Immigrants from Japan Disability Age 5 to 17

COMPARE

Immigrants from Japan
Race
Ancestry
AfghanAfricanAlaska NativeAlaskan AthabascanAlbanianAleutAlsatianAmericanApacheArabArapahoArgentineanArmenianAssyrian/Chaldean/SyriacAustralianAustrianBahamianBangladeshiBarbadianBasqueBelgianBelizeanBermudanBhutaneseBlackfeetBolivianBrazilianBritishBritish West IndianBulgarianBurmeseCajunCambodianCanadianCape VerdeanCarpatho RusynCelticCentral AmericanCentral American IndianCherokeeCheyenneChickasawChileanChineseChippewaChoctawColombianColvilleComancheCosta RicanCreeCreekCroatianCrowCubanCypriotCzechCzechoslovakianDanishDelawareDominicanDutchDutch West IndianEastern EuropeanEcuadorianEgyptianEnglishEstonianEthiopianEuropeanFijianFilipinoFinnishFrenchFrench American IndianFrench CanadianGermanGerman RussianGhanaianGreekGuamanian/ChamorroGuatemalanGuyaneseHaitianHmongHonduranHopiHoumaHungarianIcelanderIndian (Asian)IndonesianInupiatIranianIraqiIrishIroquoisIsraeliItalianJamaicanJapaneseJordanianKenyanKiowaKoreanLaotianLatvianLebaneseLiberianLithuanianLumbeeLuxembourgerMacedonianMalaysianMalteseMarshalleseMenomineeMexicanMexican American IndianMongolianMoroccanNative HawaiianNavajoNepaleseNew ZealanderNicaraguanNigerianNorthern EuropeanNorwegianOkinawanOsageOttawaPaiutePakistaniPalestinianPanamanianParaguayanPennsylvania GermanPeruvianPimaPolishPortuguesePotawatomiPuebloPuerto RicanPuget Sound SalishRomanianRussianSalvadoranSamoanScandinavianScotch-IrishScottishSeminoleSenegaleseSerbianShoshoneSierra LeoneanSiouxSlavicSlovakSloveneSomaliSouth AfricanSouth AmericanSouth American IndianSoviet UnionSpaniardSpanishSpanish AmericanSpanish American IndianSri LankanSubsaharan AfricanSudaneseSwedishSwissSyrianTaiwaneseThaiTlingit-HaidaTohono O'OdhamTonganTrinidadian and TobagonianTsimshianTurkishU.S. Virgin IslanderUgandanUkrainianUruguayanUteVenezuelanVietnameseWelshWest IndianYakamaYaquiYugoslavianYumanYup'ikZimbabwean
Immigration
NonimmigrantsImmigrantsAfghanistanAfricaAlbaniaArgentinaArmeniaAsiaAustraliaAustriaBahamasBangladeshBarbadosBelarusBelgiumBelizeBoliviaBosnia and HerzegovinaBrazilBulgariaBurma/MyanmarCabo VerdeCambodiaCameroonCanadaCaribbeanCentral AmericaChileChinaColombiaCongoCosta RicaCroatiaCubaCzechoslovakiaDenmarkDominicaDominican RepublicEastern AfricaEastern AsiaEastern EuropeEcuadorEgyptEl SalvadorEnglandEritreaEthiopiaEuropeFijiFranceGermanyGhanaGreeceGrenadaGuatemalaGuyanaHaitiHondurasHong KongHungaryIndiaIndonesiaIranIraqIrelandIsraelItalyJamaicaJapanJordanKazakhstanKenyaKoreaKuwaitLaosLatin AmericaLatviaLebanonLiberiaLithuaniaMalaysiaMexicoMicronesiaMiddle AfricaMoldovaMoroccoNepalNetherlandsNicaraguaNigeriaNorth AmericaNorth MacedoniaNorthern AfricaNorthern EuropeNorwayOceaniaPakistanPanamaPeruPhilippinesPolandPortugalRomaniaRussiaSaudi ArabiaScotlandSenegalSerbiaSierra LeoneSingaporeSomaliaSouth AfricaSouth AmericaSouth Central AsiaSouth Eastern AsiaSouthern EuropeSpainSri LankaSt. Vincent and the GrenadinesSudanSwedenSwitzerlandSyriaTaiwanThailandTrinidad and TobagoTurkeyUgandaUkraineUruguayUzbekistanVenezuelaVietnamWest IndiesWestern AfricaWestern AsiaWestern EuropeYemenZaireZimbabweAzores
Select to Compare
Race
Ancestry
AfghanAfricanAlaska NativeAlaskan AthabascanAlbanianAleutAlsatianAmericanApacheArabArapahoArgentineanArmenianAssyrian/Chaldean/SyriacAustralianAustrianBahamianBangladeshiBarbadianBasqueBelgianBelizeanBermudanBhutaneseBlackfeetBolivianBrazilianBritishBritish West IndianBulgarianBurmeseCajunCambodianCanadianCape VerdeanCarpatho RusynCelticCentral AmericanCentral American IndianCherokeeCheyenneChickasawChileanChineseChippewaChoctawColombianColvilleComancheCosta RicanCreeCreekCroatianCrowCubanCypriotCzechCzechoslovakianDanishDelawareDominicanDutchDutch West IndianEastern EuropeanEcuadorianEgyptianEnglishEstonianEthiopianEuropeanFijianFilipinoFinnishFrenchFrench American IndianFrench CanadianGermanGerman RussianGhanaianGreekGuamanian/ChamorroGuatemalanGuyaneseHaitianHmongHonduranHopiHoumaHungarianIcelanderIndian (Asian)IndonesianInupiatIranianIraqiIrishIroquoisIsraeliItalianJamaicanJapaneseJordanianKenyanKiowaKoreanLaotianLatvianLebaneseLiberianLithuanianLumbeeLuxembourgerMacedonianMalaysianMalteseMarshalleseMenomineeMexicanMexican American IndianMongolianMoroccanNative HawaiianNavajoNepaleseNew ZealanderNicaraguanNigerianNorthern EuropeanNorwegianOkinawanOsageOttawaPaiutePakistaniPalestinianPanamanianParaguayanPennsylvania GermanPeruvianPimaPolishPortuguesePotawatomiPuebloPuerto RicanPuget Sound SalishRomanianRussianSalvadoranSamoanScandinavianScotch-IrishScottishSeminoleSenegaleseSerbianShoshoneSierra LeoneanSiouxSlavicSlovakSloveneSomaliSouth AfricanSouth AmericanSouth American IndianSoviet UnionSpaniardSpanishSpanish AmericanSpanish American IndianSri LankanSubsaharan AfricanSudaneseSwedishSwissSyrianTaiwaneseThaiTlingit-HaidaTohono O'OdhamTonganTrinidadian and TobagonianTsimshianTurkishU.S. Virgin IslanderUgandanUkrainianUruguayanUteVenezuelanVietnameseWelshWest IndianYakamaYaquiYugoslavianYumanYup'ikZimbabwean
Immigration
NonimmigrantsImmigrantsAfghanistanAfricaAlbaniaArgentinaArmeniaAsiaAustraliaAustriaBahamasBangladeshBarbadosBelarusBelgiumBelizeBoliviaBosnia and HerzegovinaBrazilBulgariaBurma/MyanmarCabo VerdeCambodiaCameroonCanadaCaribbeanCentral AmericaChileChinaColombiaCongoCosta RicaCroatiaCubaCzechoslovakiaDenmarkDominicaDominican RepublicEastern AfricaEastern AsiaEastern EuropeEcuadorEgyptEl SalvadorEnglandEritreaEthiopiaEuropeFijiFranceGermanyGhanaGreeceGrenadaGuatemalaGuyanaHaitiHondurasHong KongHungaryIndiaIndonesiaIranIraqIrelandIsraelItalyJamaicaJordanKazakhstanKenyaKoreaKuwaitLaosLatin AmericaLatviaLebanonLiberiaLithuaniaMalaysiaMexicoMicronesiaMiddle AfricaMoldovaMoroccoNepalNetherlandsNicaraguaNigeriaNorth AmericaNorth MacedoniaNorthern AfricaNorthern EuropeNorwayOceaniaPakistanPanamaPeruPhilippinesPolandPortugalRomaniaRussiaSaudi ArabiaScotlandSenegalSerbiaSierra LeoneSingaporeSomaliaSouth AfricaSouth AmericaSouth Central AsiaSouth Eastern AsiaSouthern EuropeSpainSri LankaSt. Vincent and the GrenadinesSudanSwedenSwitzerlandSyriaTaiwanThailandTrinidad and TobagoTurkeyUgandaUkraineUruguayUzbekistanVenezuelaVietnamWest IndiesWestern AfricaWestern AsiaWestern EuropeYemenZaireZimbabweAzores
Disability Age 5 to 17
Income
Poverty
Unemployment
Labor Participation
Family Structure
Vehicle Availability
Education Level
Disability

Immigrants from Japan Disability Age 5 to 17
Exceptional

4.9%
DISABILITY | AGE 5 TO 17
100.0/ 100
METRIC RATING
28th/ 347
METRIC RANK

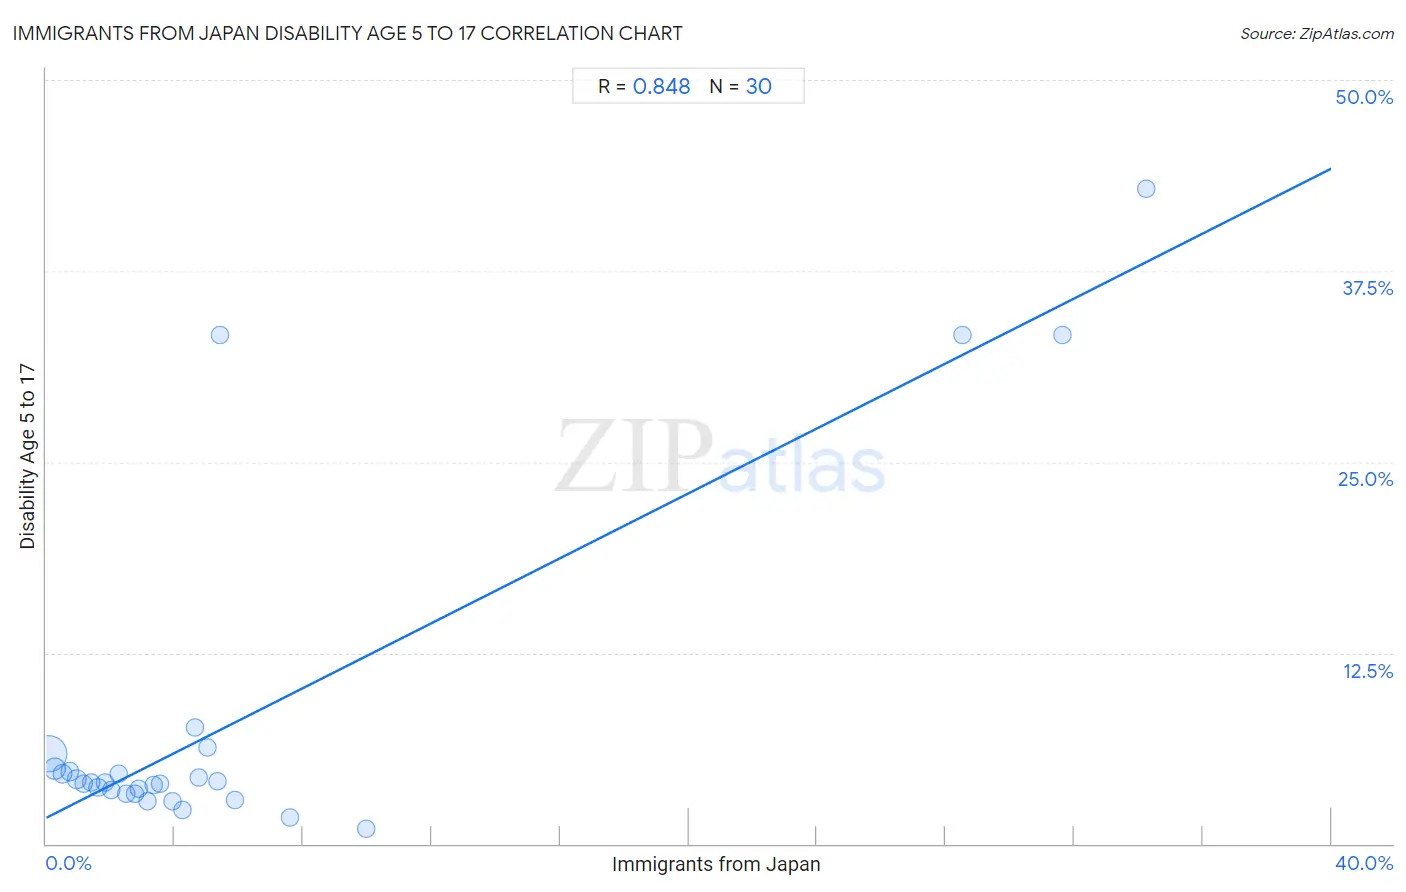
Immigrants from Japan Disability Age 5 to 17 Correlation Chart

The statistical analysis conducted on geographies consisting of 337,854,464 people shows a very strong positive correlation between the proportion of Immigrants from Japan and percentage of population with a disability between the ages 5 and 17 in the United States with a correlation coefficient (R) of 0.848 and weighted average of 4.9%. On average, for every 1% (one percent) increase in Immigrants from Japan within a typical geography, there is an increase of 1.1% in percentage of population with a disability between the ages 5 and 17.
Immigrants from Japan Disability Age 5 to 17
It is essential to understand that the correlation between the percentage of Immigrants from Japan and percentage of population with a disability between the ages 5 and 17 does not imply a direct cause-and-effect relationship. It remains uncertain whether the presence of Immigrants from Japan influences an upward or downward trend in the level of percentage of population with a disability between the ages 5 and 17 within an area, or if Immigrants from Japan simply ended up residing in those areas with higher or lower levels of percentage of population with a disability between the ages 5 and 17 due to other factors.

Demographics Similar to Immigrants from Japan by Disability Age 5 to 17

In terms of disability age 5 to 17, the demographic groups most similar to Immigrants from Japan are Taiwanese (4.9%, a difference of 0.080%), Immigrants from Serbia (4.9%, a difference of 0.48%), Bhutanese (4.9%, a difference of 0.64%), Immigrants from Malaysia (5.0%, a difference of 0.70%), and Immigrants from Pakistan (5.0%, a difference of 0.95%).
DemographicsRating | RankDisability Age 5 to 17
Yup'ik
100.0
/100
|
#21
Exceptional
4.8%
Asians
100.0
/100
|
#22
Exceptional
4.8%
Immigrants from Bolivia
100.0
/100
|
#23
Exceptional
4.8%
Immigrants from Lebanon
100.0
/100
|
#24
Exceptional
4.8%
Immigrants from Asia
100.0
/100
|
#25
Exceptional
4.8%
Bhutanese
100.0
/100
|
#26
Exceptional
4.9%
Taiwanese
100.0
/100
|
#27
Exceptional
4.9%
Immigrants from Japan
100.0
/100
|
#28
Exceptional
4.9%
Immigrants from Serbia
100.0
/100
|
#29
Exceptional
4.9%
Immigrants from Malaysia
100.0
/100
|
#30
Exceptional
5.0%
Immigrants from Pakistan
100.0
/100
|
#31
Exceptional
5.0%
Soviet Union
100.0
/100
|
#32
Exceptional
5.0%
Immigrants from Indonesia
100.0
/100
|
#33
Exceptional
5.0%
Israelis
100.0
/100
|
#34
Exceptional
5.0%
Bolivians
100.0
/100
|
#35
Exceptional
5.0%

Immigrants from Japan Disability Age 5 to 17 Correlation Summary

MeasurementImmigrants from Japan DataDisability Age 5 to 17 Data
Minimum0.077%0.95%
Maximum34.2%42.9%
Range34.2%41.9%
Mean6.1%8.2%
Median3.3%4.0%
Interquartile 25% (IQ1)1.6%3.3%
Interquartile 75% (IQ3)5.3%4.9%
Interquartile Range (IQR)3.7%1.7%
Standard Deviation (Sample)8.9%11.2%
Standard Deviation (Population)8.8%11.0%

Correlation Details

Immigrants from Japan PercentileSample SizeDisability Age 5 to 17
[
0.0%
-
0.5%
]
0.077%
252,997,5105.9%
[
0.0%
-
0.5%
]
0.28%
53,332,1434.9%
[
0.5%
-
1.0%
]
0.51%
16,627,9824.6%
[
0.5%
-
1.0%
]
0.75%
5,303,6664.7%
[
0.5%
-
1.0%
]
0.95%
2,999,1184.2%
[
1.0%
-
1.5%
]
1.17%
1,464,0503.9%
[
1.0%
-
1.5%
]
1.40%
1,748,5064.0%
[
1.5%
-
2.0%
]
1.61%
791,2283.7%
[
1.5%
-
2.0%
]
1.84%
450,1874.0%
[
2.0%
-
2.5%
]
2.04%
251,2803.5%
[
2.0%
-
2.5%
]
2.27%
188,2334.6%
[
2.5%
-
3.0%
]
2.51%
71,4603.3%
[
2.5%
-
3.0%
]
2.75%
69,6763.2%
[
2.5%
-
3.0%
]
2.88%
171,7823.6%
[
3.0%
-
3.5%
]
3.14%
65,0122.8%
[
3.0%
-
3.5%
]
3.36%
707,2683.9%
[
3.5%
-
4.0%
]
3.55%
165,7564.0%
[
3.5%
-
4.0%
]
3.92%
30,3542.8%
[
4.0%
-
4.5%
]
4.23%
66,9182.2%
[
4.5%
-
5.0%
]
4.63%
30,0687.6%
[
4.5%
-
5.0%
]
4.74%
202,3834.3%
[
5.0%
-
5.5%
]
5.01%
36,2146.3%
[
5.0%
-
5.5%
]
5.32%
13,3524.1%
[
5.0%
-
5.5%
]
5.41%
3733.3%
[
5.5%
-
6.0%
]
5.89%
5432.9%
[
7.5%
-
8.0%
]
7.59%
41,8061.7%
[
9.5%
-
10.0%
]
9.98%
27,0100.95%
[
28.5%
-
29.0%
]
28.53%
36833.3%
[
31.5%
-
32.0%
]
31.63%
33233.3%
[
34.0%
-
34.5%
]
34.23%
22242.9%