Argentinean Disability Age 5 to 17
COMPARE
Argentinean
Select to Compare
Disability Age 5 to 17
Argentinean Disability Age 5 to 17
5.1%
DISABILITY | AGE 5 TO 17
99.9/ 100
METRIC RATING
50th/ 347
METRIC RANK
Argentinean Disability Age 5 to 17 Correlation Chart
The statistical analysis conducted on geographies consisting of 295,397,898 people shows a slight negative correlation between the proportion of Argentineans and percentage of population with a disability between the ages 5 and 17 in the United States with a correlation coefficient (R) of -0.079 and weighted average of 5.1%. On average, for every 1% (one percent) increase in Argentineans within a typical geography, there is a decrease of 0.071% in percentage of population with a disability between the ages 5 and 17.
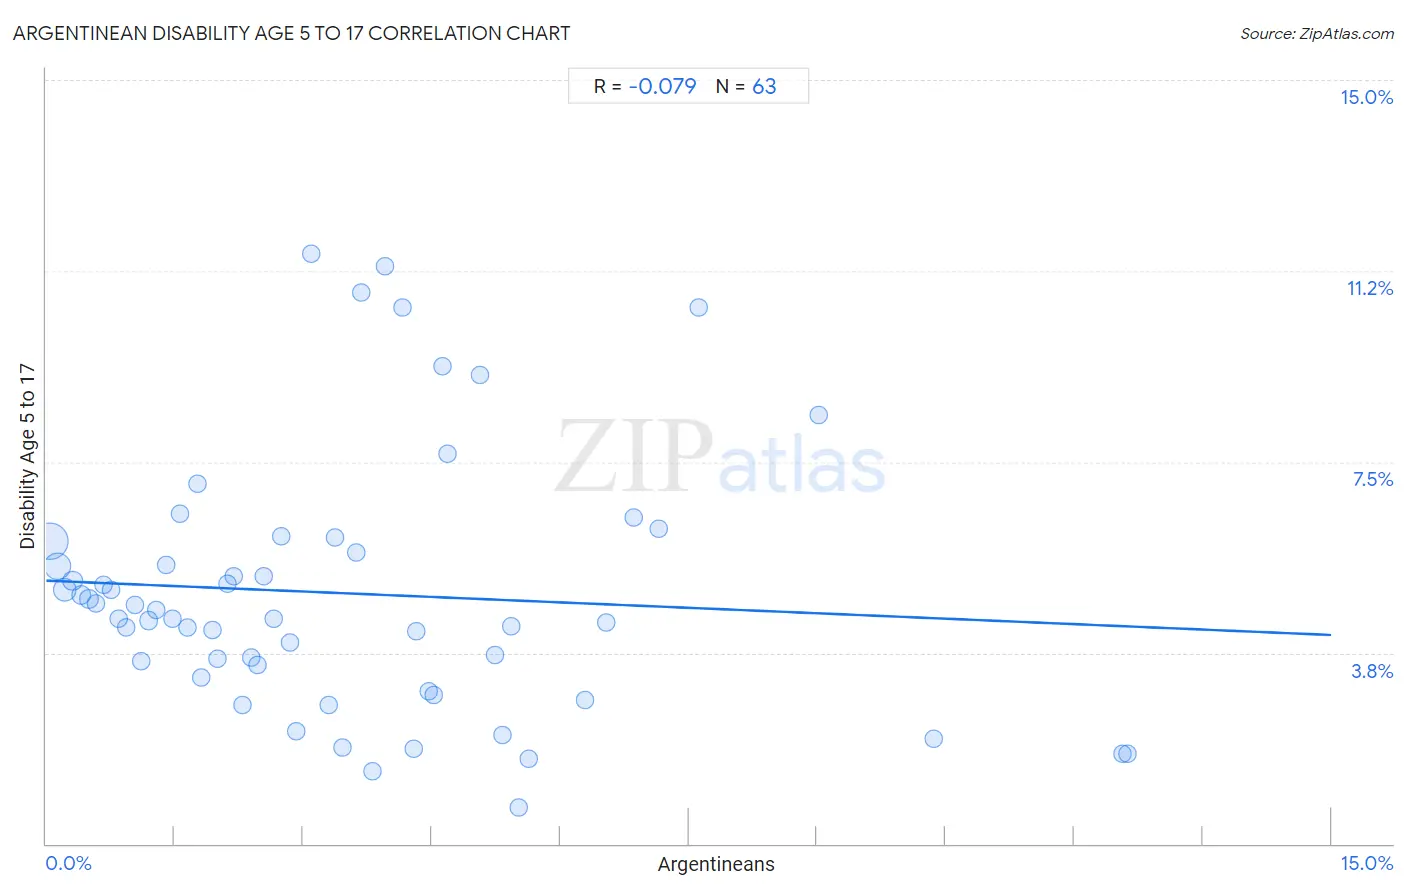
It is essential to understand that the correlation between the percentage of Argentineans and percentage of population with a disability between the ages 5 and 17 does not imply a direct cause-and-effect relationship. It remains uncertain whether the presence of Argentineans influences an upward or downward trend in the level of percentage of population with a disability between the ages 5 and 17 within an area, or if Argentineans simply ended up residing in those areas with higher or lower levels of percentage of population with a disability between the ages 5 and 17 due to other factors.
Demographics Similar to Argentineans by Disability Age 5 to 17
In terms of disability age 5 to 17, the demographic groups most similar to Argentineans are Turkish (5.1%, a difference of 0.29%), Immigrants from Fiji (5.1%, a difference of 0.38%), Immigrants from Western Asia (5.1%, a difference of 0.41%), Immigrants from Lithuania (5.1%, a difference of 0.44%), and Paraguayan (5.1%, a difference of 0.47%).
| Demographics | Rating | Rank | Disability Age 5 to 17 |
| Immigrants from Russia | 100.0 /100 | #43 | Exceptional 5.0% |
| Egyptians | 100.0 /100 | #44 | Exceptional 5.0% |
| Tongans | 100.0 /100 | #45 | Exceptional 5.0% |
| Assyrians/Chaldeans/Syriacs | 100.0 /100 | #46 | Exceptional 5.0% |
| Vietnamese | 100.0 /100 | #47 | Exceptional 5.1% |
| Koreans | 100.0 /100 | #48 | Exceptional 5.1% |
| Immigrants from Western Asia | 100.0 /100 | #49 | Exceptional 5.1% |
| Argentineans | 99.9 /100 | #50 | Exceptional 5.1% |
| Turks | 99.9 /100 | #51 | Exceptional 5.1% |
| Immigrants from Fiji | 99.9 /100 | #52 | Exceptional 5.1% |
| Immigrants from Lithuania | 99.9 /100 | #53 | Exceptional 5.1% |
| Paraguayans | 99.9 /100 | #54 | Exceptional 5.1% |
| Laotians | 99.9 /100 | #55 | Exceptional 5.1% |
| Immigrants from Turkey | 99.9 /100 | #56 | Exceptional 5.1% |
| Immigrants from Poland | 99.9 /100 | #57 | Exceptional 5.1% |
Argentinean Disability Age 5 to 17 Correlation Summary
| Measurement | Argentinean Data | Disability Age 5 to 17 Data |
| Minimum | 0.045% | 0.71% |
| Maximum | 12.6% | 11.6% |
| Range | 12.6% | 10.9% |
| Mean | 3.5% | 4.9% |
| Median | 2.8% | 4.4% |
| Interquartile 25% (IQ1) | 1.4% | 3.3% |
| Interquartile 75% (IQ3) | 4.7% | 5.9% |
| Interquartile Range (IQR) | 3.3% | 2.7% |
| Standard Deviation (Sample) | 2.8% | 2.5% |
| Standard Deviation (Population) | 2.8% | 2.5% |
Correlation Details
| Argentinean Percentile | Sample Size | Disability Age 5 to 17 |
[ 0.0% - 0.5% ] 0.045% | 139,261,276 | 5.9% |
[ 0.0% - 0.5% ] 0.13% | 64,912,984 | 5.4% |
[ 0.0% - 0.5% ] 0.22% | 40,333,642 | 5.0% |
[ 0.0% - 0.5% ] 0.31% | 16,389,342 | 5.2% |
[ 0.0% - 0.5% ] 0.40% | 9,939,569 | 4.9% |
[ 0.0% - 0.5% ] 0.50% | 6,230,453 | 4.8% |
[ 0.5% - 1.0% ] 0.58% | 4,063,147 | 4.7% |
[ 0.5% - 1.0% ] 0.67% | 2,928,912 | 5.1% |
[ 0.5% - 1.0% ] 0.75% | 2,532,906 | 5.0% |
[ 0.5% - 1.0% ] 0.85% | 1,311,383 | 4.4% |
[ 0.5% - 1.0% ] 0.93% | 1,019,164 | 4.2% |
[ 1.0% - 1.5% ] 1.03% | 941,171 | 4.7% |
[ 1.0% - 1.5% ] 1.11% | 660,293 | 3.6% |
[ 1.0% - 1.5% ] 1.20% | 981,339 | 4.4% |
[ 1.0% - 1.5% ] 1.29% | 538,435 | 4.6% |
[ 1.0% - 1.5% ] 1.40% | 845,560 | 5.5% |
[ 1.0% - 1.5% ] 1.48% | 259,479 | 4.4% |
[ 1.5% - 2.0% ] 1.56% | 204,800 | 6.5% |
[ 1.5% - 2.0% ] 1.64% | 164,160 | 4.2% |
[ 1.5% - 2.0% ] 1.76% | 235,955 | 7.1% |
[ 1.5% - 2.0% ] 1.81% | 145,840 | 3.3% |
[ 1.5% - 2.0% ] 1.93% | 120,862 | 4.2% |
[ 1.5% - 2.0% ] 2.00% | 201,321 | 3.6% |
[ 2.0% - 2.5% ] 2.12% | 70,199 | 5.1% |
[ 2.0% - 2.5% ] 2.19% | 96,789 | 5.3% |
[ 2.0% - 2.5% ] 2.29% | 25,513 | 2.7% |
[ 2.0% - 2.5% ] 2.39% | 32,714 | 3.7% |
[ 2.0% - 2.5% ] 2.46% | 95,675 | 3.5% |
[ 2.5% - 3.0% ] 2.55% | 29,621 | 5.2% |
[ 2.5% - 3.0% ] 2.65% | 75,439 | 4.4% |
[ 2.5% - 3.0% ] 2.75% | 55,569 | 6.0% |
[ 2.5% - 3.0% ] 2.84% | 47,579 | 4.0% |
[ 2.5% - 3.0% ] 2.92% | 15,184 | 2.2% |
[ 3.0% - 3.5% ] 3.09% | 93,110 | 11.6% |
[ 3.0% - 3.5% ] 3.30% | 546 | 2.7% |
[ 3.0% - 3.5% ] 3.37% | 71,289 | 6.0% |
[ 3.0% - 3.5% ] 3.46% | 73,622 | 1.9% |
[ 3.5% - 4.0% ] 3.62% | 56,475 | 5.7% |
[ 3.5% - 4.0% ] 3.68% | 4,784 | 10.8% |
[ 3.5% - 4.0% ] 3.80% | 6,651 | 1.4% |
[ 3.5% - 4.0% ] 3.95% | 12,081 | 11.3% |
[ 4.0% - 4.5% ] 4.15% | 289 | 10.5% |
[ 4.0% - 4.5% ] 4.29% | 1,400 | 1.9% |
[ 4.0% - 4.5% ] 4.31% | 12,474 | 4.2% |
[ 4.0% - 4.5% ] 4.46% | 13,255 | 3.0% |
[ 4.5% - 5.0% ] 4.52% | 4,801 | 2.9% |
[ 4.5% - 5.0% ] 4.63% | 23,734 | 9.4% |
[ 4.5% - 5.0% ] 4.68% | 32,881 | 7.7% |
[ 5.0% - 5.5% ] 5.07% | 2,624 | 9.2% |
[ 5.0% - 5.5% ] 5.24% | 98,850 | 3.7% |
[ 5.0% - 5.5% ] 5.33% | 4,972 | 2.1% |
[ 5.0% - 5.5% ] 5.43% | 11,638 | 4.3% |
[ 5.5% - 6.0% ] 5.51% | 7,388 | 0.71% |
[ 5.5% - 6.0% ] 5.63% | 1,686 | 1.7% |
[ 6.0% - 6.5% ] 6.29% | 19,785 | 2.8% |
[ 6.5% - 7.0% ] 6.54% | 35,967 | 4.4% |
[ 6.5% - 7.0% ] 6.85% | 3,589 | 6.4% |
[ 7.0% - 7.5% ] 7.15% | 5,290 | 6.2% |
[ 7.5% - 8.0% ] 7.62% | 210 | 10.5% |
[ 9.0% - 9.5% ] 9.02% | 2,461 | 8.4% |
[ 10.0% - 10.5% ] 10.36% | 560 | 2.1% |
[ 12.5% - 13.0% ] 12.57% | 14,639 | 1.8% |
[ 12.5% - 13.0% ] 12.63% | 14,572 | 1.8% |