Tlingit-Haida Family Households with Children

COMPARE

Tlingit-Haida
Race
Ancestry
AfghanAfricanAlaska NativeAlaskan AthabascanAlbanianAleutAlsatianAmericanApacheArabArapahoArgentineanArmenianAssyrian/Chaldean/SyriacAustralianAustrianBahamianBangladeshiBarbadianBasqueBelgianBelizeanBermudanBhutaneseBlackfeetBolivianBrazilianBritishBritish West IndianBulgarianBurmeseCajunCambodianCanadianCape VerdeanCarpatho RusynCelticCentral AmericanCentral American IndianCherokeeCheyenneChickasawChileanChineseChippewaChoctawColombianColvilleComancheCosta RicanCreeCreekCroatianCrowCubanCypriotCzechCzechoslovakianDanishDelawareDominicanDutchDutch West IndianEastern EuropeanEcuadorianEgyptianEnglishEstonianEthiopianEuropeanFijianFilipinoFinnishFrenchFrench American IndianFrench CanadianGermanGerman RussianGhanaianGreekGuamanian/ChamorroGuatemalanGuyaneseHaitianHmongHonduranHopiHoumaHungarianIcelanderIndian (Asian)IndonesianInupiatIranianIraqiIrishIroquoisIsraeliItalianJamaicanJapaneseJordanianKenyanKiowaKoreanLaotianLatvianLebaneseLiberianLithuanianLumbeeLuxembourgerMacedonianMalaysianMalteseMarshalleseMenomineeMexicanMexican American IndianMongolianMoroccanNative HawaiianNavajoNepaleseNew ZealanderNicaraguanNigerianNorthern EuropeanNorwegianOkinawanOsageOttawaPaiutePakistaniPalestinianPanamanianParaguayanPennsylvania GermanPeruvianPimaPolishPortuguesePotawatomiPuebloPuerto RicanPuget Sound SalishRomanianRussianSalvadoranSamoanScandinavianScotch-IrishScottishSeminoleSenegaleseSerbianShoshoneSierra LeoneanSiouxSlavicSlovakSloveneSomaliSouth AfricanSouth AmericanSouth American IndianSoviet UnionSpaniardSpanishSpanish AmericanSpanish American IndianSri LankanSubsaharan AfricanSudaneseSwedishSwissSyrianTaiwaneseThaiTlingit-HaidaTohono O'OdhamTonganTrinidadian and TobagonianTsimshianTurkishU.S. Virgin IslanderUgandanUkrainianUruguayanUteVenezuelanVietnameseWelshWest IndianYakamaYaquiYugoslavianYumanYup'ikZimbabwean
Immigration
NonimmigrantsImmigrantsAfghanistanAfricaAlbaniaArgentinaArmeniaAsiaAustraliaAustriaBahamasBangladeshBarbadosBelarusBelgiumBelizeBoliviaBosnia and HerzegovinaBrazilBulgariaBurma/MyanmarCabo VerdeCambodiaCameroonCanadaCaribbeanCentral AmericaChileChinaColombiaCongoCosta RicaCroatiaCubaCzechoslovakiaDenmarkDominicaDominican RepublicEastern AfricaEastern AsiaEastern EuropeEcuadorEgyptEl SalvadorEnglandEritreaEthiopiaEuropeFijiFranceGermanyGhanaGreeceGrenadaGuatemalaGuyanaHaitiHondurasHong KongHungaryIndiaIndonesiaIranIraqIrelandIsraelItalyJamaicaJapanJordanKazakhstanKenyaKoreaKuwaitLaosLatin AmericaLatviaLebanonLiberiaLithuaniaMalaysiaMexicoMicronesiaMiddle AfricaMoldovaMoroccoNepalNetherlandsNicaraguaNigeriaNorth AmericaNorth MacedoniaNorthern AfricaNorthern EuropeNorwayOceaniaPakistanPanamaPeruPhilippinesPolandPortugalRomaniaRussiaSaudi ArabiaScotlandSenegalSerbiaSierra LeoneSingaporeSomaliaSouth AfricaSouth AmericaSouth Central AsiaSouth Eastern AsiaSouthern EuropeSpainSri LankaSt. Vincent and the GrenadinesSudanSwedenSwitzerlandSyriaTaiwanThailandTrinidad and TobagoTurkeyUgandaUkraineUruguayUzbekistanVenezuelaVietnamWest IndiesWestern AfricaWestern AsiaWestern EuropeYemenZaireZimbabweAzores
Select to Compare
Race
Ancestry
AfghanAfricanAlaska NativeAlaskan AthabascanAlbanianAleutAlsatianAmericanApacheArabArapahoArgentineanArmenianAssyrian/Chaldean/SyriacAustralianAustrianBahamianBangladeshiBarbadianBasqueBelgianBelizeanBermudanBhutaneseBlackfeetBolivianBrazilianBritishBritish West IndianBulgarianBurmeseCajunCambodianCanadianCape VerdeanCarpatho RusynCelticCentral AmericanCentral American IndianCherokeeCheyenneChickasawChileanChineseChippewaChoctawColombianColvilleComancheCosta RicanCreeCreekCroatianCrowCubanCypriotCzechCzechoslovakianDanishDelawareDominicanDutchDutch West IndianEastern EuropeanEcuadorianEgyptianEnglishEstonianEthiopianEuropeanFijianFilipinoFinnishFrenchFrench American IndianFrench CanadianGermanGerman RussianGhanaianGreekGuamanian/ChamorroGuatemalanGuyaneseHaitianHmongHonduranHopiHoumaHungarianIcelanderIndian (Asian)IndonesianInupiatIranianIraqiIrishIroquoisIsraeliItalianJamaicanJapaneseJordanianKenyanKiowaKoreanLaotianLatvianLebaneseLiberianLithuanianLumbeeLuxembourgerMacedonianMalaysianMalteseMarshalleseMenomineeMexicanMexican American IndianMongolianMoroccanNative HawaiianNavajoNepaleseNew ZealanderNicaraguanNigerianNorthern EuropeanNorwegianOkinawanOsageOttawaPaiutePakistaniPalestinianPanamanianParaguayanPennsylvania GermanPeruvianPimaPolishPortuguesePotawatomiPuebloPuerto RicanPuget Sound SalishRomanianRussianSalvadoranSamoanScandinavianScotch-IrishScottishSeminoleSenegaleseSerbianShoshoneSierra LeoneanSiouxSlavicSlovakSloveneSomaliSouth AfricanSouth AmericanSouth American IndianSoviet UnionSpaniardSpanishSpanish AmericanSpanish American IndianSri LankanSubsaharan AfricanSudaneseSwedishSwissSyrianTaiwaneseThaiTohono O'OdhamTonganTrinidadian and TobagonianTsimshianTurkishU.S. Virgin IslanderUgandanUkrainianUruguayanUteVenezuelanVietnameseWelshWest IndianYakamaYaquiYugoslavianYumanYup'ikZimbabwean
Immigration
NonimmigrantsImmigrantsAfghanistanAfricaAlbaniaArgentinaArmeniaAsiaAustraliaAustriaBahamasBangladeshBarbadosBelarusBelgiumBelizeBoliviaBosnia and HerzegovinaBrazilBulgariaBurma/MyanmarCabo VerdeCambodiaCameroonCanadaCaribbeanCentral AmericaChileChinaColombiaCongoCosta RicaCroatiaCubaCzechoslovakiaDenmarkDominicaDominican RepublicEastern AfricaEastern AsiaEastern EuropeEcuadorEgyptEl SalvadorEnglandEritreaEthiopiaEuropeFijiFranceGermanyGhanaGreeceGrenadaGuatemalaGuyanaHaitiHondurasHong KongHungaryIndiaIndonesiaIranIraqIrelandIsraelItalyJamaicaJapanJordanKazakhstanKenyaKoreaKuwaitLaosLatin AmericaLatviaLebanonLiberiaLithuaniaMalaysiaMexicoMicronesiaMiddle AfricaMoldovaMoroccoNepalNetherlandsNicaraguaNigeriaNorth AmericaNorth MacedoniaNorthern AfricaNorthern EuropeNorwayOceaniaPakistanPanamaPeruPhilippinesPolandPortugalRomaniaRussiaSaudi ArabiaScotlandSenegalSerbiaSierra LeoneSingaporeSomaliaSouth AfricaSouth AmericaSouth Central AsiaSouth Eastern AsiaSouthern EuropeSpainSri LankaSt. Vincent and the GrenadinesSudanSwedenSwitzerlandSyriaTaiwanThailandTrinidad and TobagoTurkeyUgandaUkraineUruguayUzbekistanVenezuelaVietnamWest IndiesWestern AfricaWestern AsiaWestern EuropeYemenZaireZimbabweAzores
Family Households with Children
Income
Poverty
Unemployment
Labor Participation
Family Structure
Vehicle Availability
Education Level
Disability

Tlingit-Haida Family Households with Children
Tragic

26.0%
FAMILY HOUSEHOLDS WITH CHILDREN
0.0/ 100
METRIC RATING
320th/ 347
METRIC RANK

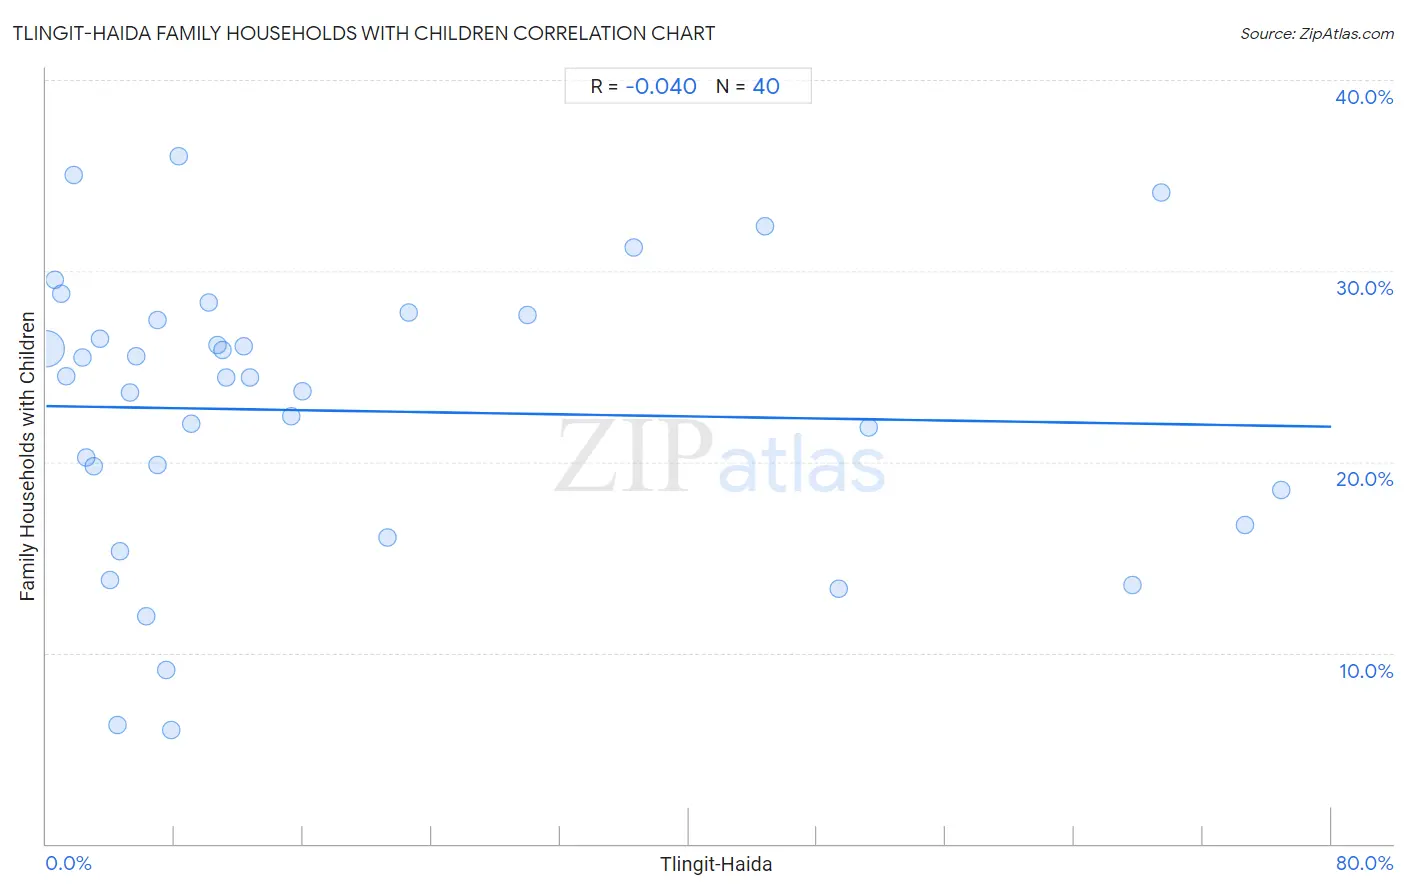
Tlingit-Haida Family Households with Children Correlation Chart

The statistical analysis conducted on geographies consisting of 60,854,309 people shows no correlation between the proportion of Tlingit-Haida and percentage of family households with children in the United States with a correlation coefficient (R) of -0.040 and weighted average of 26.0%. On average, for every 1% (one percent) increase in Tlingit-Haida within a typical geography, there is a decrease of 0.014% in percentage of family households with children.
Tlingit-Haida Family Households with Children
It is essential to understand that the correlation between the percentage of Tlingit-Haida and percentage of family households with children does not imply a direct cause-and-effect relationship. It remains uncertain whether the presence of Tlingit-Haida influences an upward or downward trend in the level of percentage of family households with children within an area, or if Tlingit-Haida simply ended up residing in those areas with higher or lower levels of percentage of family households with children due to other factors.

Demographics Similar to Tlingit-Haida by Family Households with Children

In terms of family households with children, the demographic groups most similar to Tlingit-Haida are British West Indian (26.0%, a difference of 0.010%), Immigrants from France (26.0%, a difference of 0.020%), Immigrants from Greece (26.0%, a difference of 0.030%), Immigrants from Australia (26.0%, a difference of 0.060%), and Chinese (26.0%, a difference of 0.090%).
DemographicsRating | RankFamily Households with Children
Cree
0.0
/100
|
#313
Tragic
26.2%
French Canadians
0.0
/100
|
#314
Tragic
26.1%
Immigrants from Norway
0.0
/100
|
#315
Tragic
26.1%
Estonians
0.0
/100
|
#316
Tragic
26.1%
Ottawa
0.0
/100
|
#317
Tragic
26.1%
Iroquois
0.0
/100
|
#318
Tragic
26.1%
Immigrants from France
0.0
/100
|
#319
Tragic
26.0%
Tlingit-Haida
0.0
/100
|
#320
Tragic
26.0%
British West Indians
0.0
/100
|
#321
Tragic
26.0%
Immigrants from Greece
0.0
/100
|
#322
Tragic
26.0%
Immigrants from Australia
0.0
/100
|
#323
Tragic
26.0%
Chinese
0.0
/100
|
#324
Tragic
26.0%
Barbadians
0.0
/100
|
#325
Tragic
26.0%
Immigrants from Ireland
0.0
/100
|
#326
Tragic
26.0%
Immigrants from Barbados
0.0
/100
|
#327
Tragic
26.0%

Tlingit-Haida Family Households with Children Correlation Summary

MeasurementTlingit-Haida DataFamily Households with Children Data
Minimum0.036%6.0%
Maximum76.8%36.0%
Range76.8%30.0%
Mean18.4%22.7%
Median8.6%24.4%
Interquartile 25% (IQ1)4.2%17.6%
Interquartile 75% (IQ3)21.9%27.6%
Interquartile Range (IQR)17.7%10.0%
Standard Deviation (Sample)22.3%7.5%
Standard Deviation (Population)22.0%7.4%

Correlation Details

Tlingit-Haida PercentileSample SizeFamily Households with Children
[
0.0%
-
0.5%
]
0.036%
59,016,73525.9%
[
0.5%
-
1.0%
]
0.54%
1,312,33929.5%
[
0.5%
-
1.0%
]
0.91%
246,81028.8%
[
1.0%
-
1.5%
]
1.24%
85,68724.5%
[
1.5%
-
2.0%
]
1.71%
25,68535.0%
[
2.0%
-
2.5%
]
2.28%
8,44725.5%
[
2.0%
-
2.5%
]
2.46%
3,65520.3%
[
2.5%
-
3.0%
]
2.92%
6,19419.7%
[
3.0%
-
3.5%
]
3.33%
10,32626.5%
[
3.5%
-
4.0%
]
3.97%
1,96413.8%
[
4.0%
-
4.5%
]
4.41%
686.2%
[
4.5%
-
5.0%
]
4.62%
82215.3%
[
5.0%
-
5.5%
]
5.24%
42023.6%
[
5.5%
-
6.0%
]
5.62%
1,76225.5%
[
6.0%
-
6.5%
]
6.21%
17711.9%
[
6.5%
-
7.0%
]
6.91%
56427.4%
[
6.5%
-
7.0%
]
6.94%
2,14619.9%
[
7.0%
-
7.5%
]
7.50%
409.1%
[
7.5%
-
8.0%
]
7.80%
1,2576.0%
[
8.0%
-
8.5%
]
8.22%
14636.0%
[
8.5%
-
9.0%
]
9.00%
6,69122.0%
[
10.0%
-
10.5%
]
10.13%
2,90228.3%
[
10.5%
-
11.0%
]
10.70%
29,93326.2%
[
11.0%
-
11.5%
]
11.00%
32,10825.9%
[
11.0%
-
11.5%
]
11.18%
13,91324.4%
[
12.0%
-
12.5%
]
12.26%
18,04126.1%
[
12.5%
-
13.0%
]
12.66%
8,64724.4%
[
15.0%
-
15.5%
]
15.26%
2,16922.4%
[
15.5%
-
16.0%
]
15.92%
1,72723.7%
[
21.0%
-
21.5%
]
21.23%
4,26716.1%
[
22.5%
-
23.0%
]
22.55%
1,07327.8%
[
29.5%
-
30.0%
]
29.96%
1,12827.7%
[
36.5%
-
37.0%
]
36.59%
8231.2%
[
44.5%
-
45.0%
]
44.78%
92032.4%
[
49.0%
-
49.5%
]
49.33%
1,79213.4%
[
51.0%
-
51.5%
]
51.24%
80421.8%
[
67.5%
-
68.0%
]
67.59%
36113.6%
[
69.0%
-
69.5%
]
69.41%
1,60234.1%
[
74.5%
-
75.0%
]
74.63%
6716.7%
[
76.5%
-
77.0%
]
76.85%
83818.5%