Russian Disability Age 5 to 17

COMPARE

Russian
Race
Ancestry
AfghanAfricanAlaska NativeAlaskan AthabascanAlbanianAleutAlsatianAmericanApacheArabArapahoArgentineanArmenianAssyrian/Chaldean/SyriacAustralianAustrianBahamianBangladeshiBarbadianBasqueBelgianBelizeanBermudanBhutaneseBlackfeetBolivianBrazilianBritishBritish West IndianBulgarianBurmeseCajunCambodianCanadianCape VerdeanCarpatho RusynCelticCentral AmericanCentral American IndianCherokeeCheyenneChickasawChileanChineseChippewaChoctawColombianColvilleComancheCosta RicanCreeCreekCroatianCrowCubanCypriotCzechCzechoslovakianDanishDelawareDominicanDutchDutch West IndianEastern EuropeanEcuadorianEgyptianEnglishEstonianEthiopianEuropeanFijianFilipinoFinnishFrenchFrench American IndianFrench CanadianGermanGerman RussianGhanaianGreekGuamanian/ChamorroGuatemalanGuyaneseHaitianHmongHonduranHopiHoumaHungarianIcelanderIndian (Asian)IndonesianInupiatIranianIraqiIrishIroquoisIsraeliItalianJamaicanJapaneseJordanianKenyanKiowaKoreanLaotianLatvianLebaneseLiberianLithuanianLumbeeLuxembourgerMacedonianMalaysianMalteseMarshalleseMenomineeMexicanMexican American IndianMongolianMoroccanNative HawaiianNavajoNepaleseNew ZealanderNicaraguanNigerianNorthern EuropeanNorwegianOkinawanOsageOttawaPaiutePakistaniPalestinianPanamanianParaguayanPennsylvania GermanPeruvianPimaPolishPortuguesePotawatomiPuebloPuerto RicanPuget Sound SalishRomanianRussianSalvadoranSamoanScandinavianScotch-IrishScottishSeminoleSenegaleseSerbianShoshoneSierra LeoneanSiouxSlavicSlovakSloveneSomaliSouth AfricanSouth AmericanSouth American IndianSoviet UnionSpaniardSpanishSpanish AmericanSpanish American IndianSri LankanSubsaharan AfricanSudaneseSwedishSwissSyrianTaiwaneseThaiTlingit-HaidaTohono O'OdhamTonganTrinidadian and TobagonianTsimshianTurkishU.S. Virgin IslanderUgandanUkrainianUruguayanUteVenezuelanVietnameseWelshWest IndianYakamaYaquiYugoslavianYumanYup'ikZimbabwean
Immigration
NonimmigrantsImmigrantsAfghanistanAfricaAlbaniaArgentinaArmeniaAsiaAustraliaAustriaBahamasBangladeshBarbadosBelarusBelgiumBelizeBoliviaBosnia and HerzegovinaBrazilBulgariaBurma/MyanmarCabo VerdeCambodiaCameroonCanadaCaribbeanCentral AmericaChileChinaColombiaCongoCosta RicaCroatiaCubaCzechoslovakiaDenmarkDominicaDominican RepublicEastern AfricaEastern AsiaEastern EuropeEcuadorEgyptEl SalvadorEnglandEritreaEthiopiaEuropeFijiFranceGermanyGhanaGreeceGrenadaGuatemalaGuyanaHaitiHondurasHong KongHungaryIndiaIndonesiaIranIraqIrelandIsraelItalyJamaicaJapanJordanKazakhstanKenyaKoreaKuwaitLaosLatin AmericaLatviaLebanonLiberiaLithuaniaMalaysiaMexicoMicronesiaMiddle AfricaMoldovaMoroccoNepalNetherlandsNicaraguaNigeriaNorth AmericaNorth MacedoniaNorthern AfricaNorthern EuropeNorwayOceaniaPakistanPanamaPeruPhilippinesPolandPortugalRomaniaRussiaSaudi ArabiaScotlandSenegalSerbiaSierra LeoneSingaporeSomaliaSouth AfricaSouth AmericaSouth Central AsiaSouth Eastern AsiaSouthern EuropeSpainSri LankaSt. Vincent and the GrenadinesSudanSwedenSwitzerlandSyriaTaiwanThailandTrinidad and TobagoTurkeyUgandaUkraineUruguayUzbekistanVenezuelaVietnamWest IndiesWestern AfricaWestern AsiaWestern EuropeYemenZaireZimbabweAzores
Select to Compare
Race
Ancestry
AfghanAfricanAlaska NativeAlaskan AthabascanAlbanianAleutAlsatianAmericanApacheArabArapahoArgentineanArmenianAssyrian/Chaldean/SyriacAustralianAustrianBahamianBangladeshiBarbadianBasqueBelgianBelizeanBermudanBhutaneseBlackfeetBolivianBrazilianBritishBritish West IndianBulgarianBurmeseCajunCambodianCanadianCape VerdeanCarpatho RusynCelticCentral AmericanCentral American IndianCherokeeCheyenneChickasawChileanChineseChippewaChoctawColombianColvilleComancheCosta RicanCreeCreekCroatianCrowCubanCypriotCzechCzechoslovakianDanishDelawareDominicanDutchDutch West IndianEastern EuropeanEcuadorianEgyptianEnglishEstonianEthiopianEuropeanFijianFilipinoFinnishFrenchFrench American IndianFrench CanadianGermanGerman RussianGhanaianGreekGuamanian/ChamorroGuatemalanGuyaneseHaitianHmongHonduranHopiHoumaHungarianIcelanderIndian (Asian)IndonesianInupiatIranianIraqiIrishIroquoisIsraeliItalianJamaicanJapaneseJordanianKenyanKiowaKoreanLaotianLatvianLebaneseLiberianLithuanianLumbeeLuxembourgerMacedonianMalaysianMalteseMarshalleseMenomineeMexicanMexican American IndianMongolianMoroccanNative HawaiianNavajoNepaleseNew ZealanderNicaraguanNigerianNorthern EuropeanNorwegianOkinawanOsageOttawaPaiutePakistaniPalestinianPanamanianParaguayanPennsylvania GermanPeruvianPimaPolishPortuguesePotawatomiPuebloPuerto RicanPuget Sound SalishRomanianSalvadoranSamoanScandinavianScotch-IrishScottishSeminoleSenegaleseSerbianShoshoneSierra LeoneanSiouxSlavicSlovakSloveneSomaliSouth AfricanSouth AmericanSouth American IndianSoviet UnionSpaniardSpanishSpanish AmericanSpanish American IndianSri LankanSubsaharan AfricanSudaneseSwedishSwissSyrianTaiwaneseThaiTlingit-HaidaTohono O'OdhamTonganTrinidadian and TobagonianTsimshianTurkishU.S. Virgin IslanderUgandanUkrainianUruguayanUteVenezuelanVietnameseWelshWest IndianYakamaYaquiYugoslavianYumanYup'ikZimbabwean
Immigration
NonimmigrantsImmigrantsAfghanistanAfricaAlbaniaArgentinaArmeniaAsiaAustraliaAustriaBahamasBangladeshBarbadosBelarusBelgiumBelizeBoliviaBosnia and HerzegovinaBrazilBulgariaBurma/MyanmarCabo VerdeCambodiaCameroonCanadaCaribbeanCentral AmericaChileChinaColombiaCongoCosta RicaCroatiaCubaCzechoslovakiaDenmarkDominicaDominican RepublicEastern AfricaEastern AsiaEastern EuropeEcuadorEgyptEl SalvadorEnglandEritreaEthiopiaEuropeFijiFranceGermanyGhanaGreeceGrenadaGuatemalaGuyanaHaitiHondurasHong KongHungaryIndiaIndonesiaIranIraqIrelandIsraelItalyJamaicaJapanJordanKazakhstanKenyaKoreaKuwaitLaosLatin AmericaLatviaLebanonLiberiaLithuaniaMalaysiaMexicoMicronesiaMiddle AfricaMoldovaMoroccoNepalNetherlandsNicaraguaNigeriaNorth AmericaNorth MacedoniaNorthern AfricaNorthern EuropeNorwayOceaniaPakistanPanamaPeruPhilippinesPolandPortugalRomaniaRussiaSaudi ArabiaScotlandSenegalSerbiaSierra LeoneSingaporeSomaliaSouth AfricaSouth AmericaSouth Central AsiaSouth Eastern AsiaSouthern EuropeSpainSri LankaSt. Vincent and the GrenadinesSudanSwedenSwitzerlandSyriaTaiwanThailandTrinidad and TobagoTurkeyUgandaUkraineUruguayUzbekistanVenezuelaVietnamWest IndiesWestern AfricaWestern AsiaWestern EuropeYemenZaireZimbabweAzores
Disability Age 5 to 17
Income
Poverty
Unemployment
Labor Participation
Family Structure
Vehicle Availability
Education Level
Disability

Russian Disability Age 5 to 17
Exceptional

5.3%
DISABILITY | AGE 5 TO 17
98.2/ 100
METRIC RATING
107th/ 347
METRIC RANK

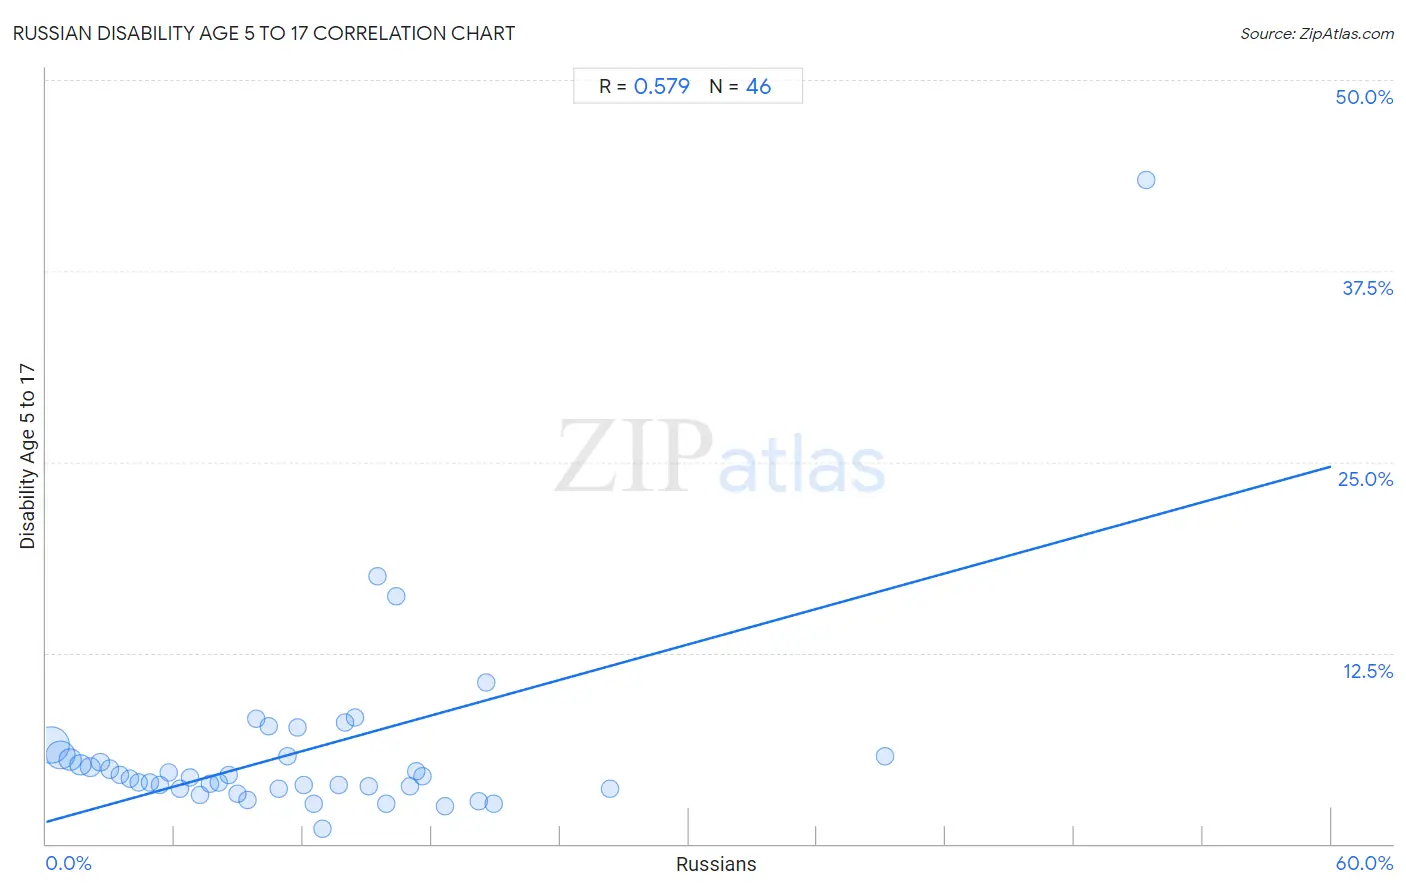
Russian Disability Age 5 to 17 Correlation Chart

The statistical analysis conducted on geographies consisting of 503,780,510 people shows a substantial positive correlation between the proportion of Russians and percentage of population with a disability between the ages 5 and 17 in the United States with a correlation coefficient (R) of 0.579 and weighted average of 5.3%. On average, for every 1% (one percent) increase in Russians within a typical geography, there is an increase of 0.39% in percentage of population with a disability between the ages 5 and 17.
Russian Disability Age 5 to 17
It is essential to understand that the correlation between the percentage of Russians and percentage of population with a disability between the ages 5 and 17 does not imply a direct cause-and-effect relationship. It remains uncertain whether the presence of Russians influences an upward or downward trend in the level of percentage of population with a disability between the ages 5 and 17 within an area, or if Russians simply ended up residing in those areas with higher or lower levels of percentage of population with a disability between the ages 5 and 17 due to other factors.

Demographics Similar to Russians by Disability Age 5 to 17

In terms of disability age 5 to 17, the demographic groups most similar to Russians are Immigrants from Yemen (5.3%, a difference of 0.030%), Immigrants from South Africa (5.3%, a difference of 0.040%), Immigrants from Northern Africa (5.3%, a difference of 0.080%), Immigrants from Eritrea (5.3%, a difference of 0.12%), and Immigrants from Italy (5.3%, a difference of 0.16%).
DemographicsRating | RankDisability Age 5 to 17
Nepalese
98.7
/100
|
#100
Exceptional
5.3%
Menominee
98.7
/100
|
#101
Exceptional
5.3%
Nicaraguans
98.6
/100
|
#102
Exceptional
5.3%
Salvadorans
98.6
/100
|
#103
Exceptional
5.3%
Peruvians
98.5
/100
|
#104
Exceptional
5.3%
Immigrants from Italy
98.4
/100
|
#105
Exceptional
5.3%
Immigrants from Yemen
98.2
/100
|
#106
Exceptional
5.3%
Russians
98.2
/100
|
#107
Exceptional
5.3%
Immigrants from South Africa
98.1
/100
|
#108
Exceptional
5.3%
Immigrants from Northern Africa
98.1
/100
|
#109
Exceptional
5.3%
Immigrants from Eritrea
98.0
/100
|
#110
Exceptional
5.3%
Ethiopians
97.9
/100
|
#111
Exceptional
5.3%
Immigrants from Latvia
97.9
/100
|
#112
Exceptional
5.3%
Aleuts
97.8
/100
|
#113
Exceptional
5.3%
Immigrants from Northern Europe
97.8
/100
|
#114
Exceptional
5.3%

Russian Disability Age 5 to 17 Correlation Summary

MeasurementRussian DataDisability Age 5 to 17 Data
Minimum0.22%0.98%
Maximum51.4%43.5%
Range51.2%42.5%
Mean11.9%6.0%
Median10.6%4.4%
Interquartile 25% (IQ1)5.3%3.6%
Interquartile 75% (IQ3)15.9%5.7%
Interquartile Range (IQR)10.6%2.1%
Standard Deviation (Sample)9.6%6.4%
Standard Deviation (Population)9.5%6.4%

Correlation Details

Russian PercentileSample SizeDisability Age 5 to 17
[
0.0%
-
0.5%
]
0.22%
233,421,4756.4%
[
0.5%
-
1.0%
]
0.67%
125,566,6355.8%
[
1.0%
-
1.5%
]
1.12%
57,584,5485.5%
[
1.5%
-
2.0%
]
1.60%
35,339,0395.2%
[
2.0%
-
2.5%
]
2.07%
24,559,5095.0%
[
2.5%
-
3.0%
]
2.51%
8,022,3455.3%
[
2.5%
-
3.0%
]
2.98%
5,436,2234.9%
[
3.0%
-
3.5%
]
3.44%
3,186,2284.5%
[
3.5%
-
4.0%
]
3.93%
2,274,8494.3%
[
4.0%
-
4.5%
]
4.34%
2,182,0924.0%
[
4.5%
-
5.0%
]
4.82%
1,151,8734.0%
[
5.0%
-
5.5%
]
5.30%
1,252,6473.9%
[
5.5%
-
6.0%
]
5.72%
688,0624.6%
[
6.0%
-
6.5%
]
6.23%
672,9843.6%
[
6.5%
-
7.0%
]
6.71%
583,9264.4%
[
7.0%
-
7.5%
]
7.18%
363,1023.2%
[
7.5%
-
8.0%
]
7.63%
439,3693.9%
[
8.0%
-
8.5%
]
8.07%
275,2244.0%
[
8.0%
-
8.5%
]
8.49%
108,8074.5%
[
8.5%
-
9.0%
]
8.91%
220,5843.3%
[
9.0%
-
9.5%
]
9.41%
95,6892.9%
[
9.5%
-
10.0%
]
9.79%
77,4798.2%
[
10.0%
-
10.5%
]
10.39%
57,1537.7%
[
10.5%
-
11.0%
]
10.86%
21,3453.6%
[
11.0%
-
11.5%
]
11.27%
19,3165.7%
[
11.5%
-
12.0%
]
11.75%
11,2927.6%
[
12.0%
-
12.5%
]
12.04%
27,4483.9%
[
12.0%
-
12.5%
]
12.48%
6492.6%
[
12.5%
-
13.0%
]
12.93%
13,8460.98%
[
13.5%
-
14.0%
]
13.68%
1,5503.9%
[
13.5%
-
14.0%
]
13.97%
12,6707.9%
[
14.0%
-
14.5%
]
14.42%
12,6898.3%
[
15.0%
-
15.5%
]
15.04%
4,5153.7%
[
15.0%
-
15.5%
]
15.44%
43417.5%
[
15.5%
-
16.0%
]
15.86%
1,5072.6%
[
16.0%
-
16.5%
]
16.32%
1,91216.2%
[
16.5%
-
17.0%
]
16.98%
1,0663.8%
[
17.0%
-
17.5%
]
17.25%
1,6354.7%
[
17.5%
-
18.0%
]
17.60%
83,0694.4%
[
18.5%
-
19.0%
]
18.61%
2,2892.4%
[
20.0%
-
20.5%
]
20.18%
1,2042.8%
[
20.5%
-
21.0%
]
20.55%
25310.5%
[
20.5%
-
21.0%
]
20.90%
8422.6%
[
26.0%
-
26.5%
]
26.35%
3533.6%
[
39.0%
-
39.5%
]
39.19%
7125.7%
[
51.0%
-
51.5%
]
51.39%
7243.5%