Bermudan Disability Age 5 to 17
COMPARE
Bermudan
Select to Compare
Disability Age 5 to 17
Bermudan Disability Age 5 to 17
6.4%
DISABILITY | AGE 5 TO 17
0.0/ 100
METRIC RATING
312th/ 347
METRIC RANK
Bermudan Disability Age 5 to 17 Correlation Chart
The statistical analysis conducted on geographies consisting of 55,645,998 people shows a significant positive correlation between the proportion of Bermudans and percentage of population with a disability between the ages 5 and 17 in the United States with a correlation coefficient (R) of 0.660 and weighted average of 6.4%. On average, for every 1% (one percent) increase in Bermudans within a typical geography, there is an increase of 1.5% in percentage of population with a disability between the ages 5 and 17.
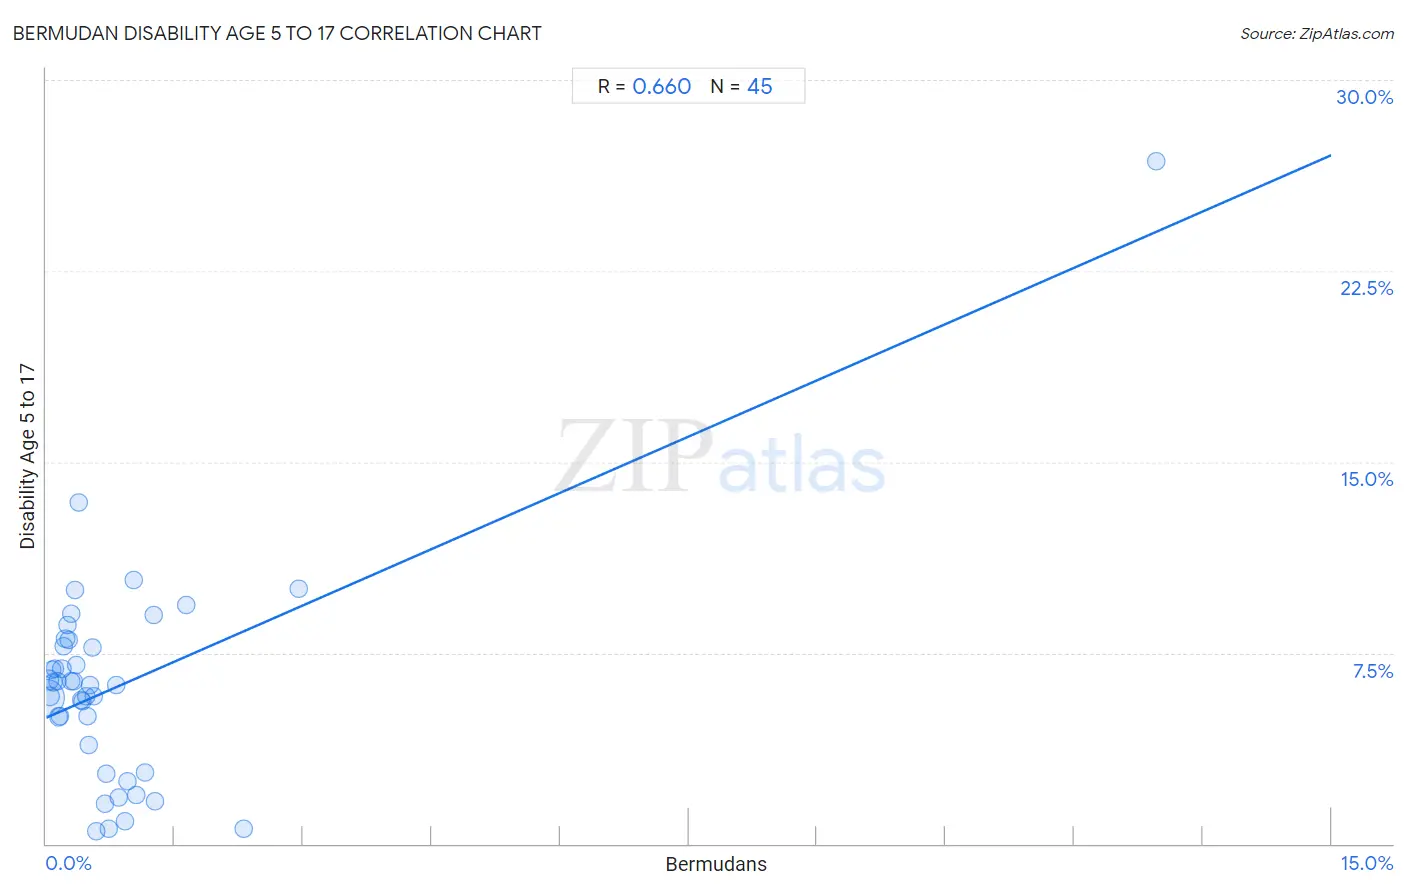
It is essential to understand that the correlation between the percentage of Bermudans and percentage of population with a disability between the ages 5 and 17 does not imply a direct cause-and-effect relationship. It remains uncertain whether the presence of Bermudans influences an upward or downward trend in the level of percentage of population with a disability between the ages 5 and 17 within an area, or if Bermudans simply ended up residing in those areas with higher or lower levels of percentage of population with a disability between the ages 5 and 17 due to other factors.
Demographics Similar to Bermudans by Disability Age 5 to 17
In terms of disability age 5 to 17, the demographic groups most similar to Bermudans are Immigrants from Dominica (6.3%, a difference of 0.12%), Alaskan Athabascan (6.3%, a difference of 0.16%), Hmong (6.3%, a difference of 0.29%), Scotch-Irish (6.3%, a difference of 0.32%), and Apache (6.4%, a difference of 0.38%).
| Demographics | Rating | Rank | Disability Age 5 to 17 |
| Natives/Alaskans | 0.0 /100 | #305 | Tragic 6.3% |
| Nonimmigrants | 0.0 /100 | #306 | Tragic 6.3% |
| Bahamians | 0.0 /100 | #307 | Tragic 6.3% |
| Scotch-Irish | 0.0 /100 | #308 | Tragic 6.3% |
| Hmong | 0.0 /100 | #309 | Tragic 6.3% |
| Alaskan Athabascans | 0.0 /100 | #310 | Tragic 6.3% |
| Immigrants from Dominica | 0.0 /100 | #311 | Tragic 6.3% |
| Bermudans | 0.0 /100 | #312 | Tragic 6.4% |
| Apache | 0.0 /100 | #313 | Tragic 6.4% |
| French | 0.0 /100 | #314 | Tragic 6.4% |
| Immigrants from Portugal | 0.0 /100 | #315 | Tragic 6.4% |
| Immigrants from Dominican Republic | 0.0 /100 | #316 | Tragic 6.4% |
| Kiowa | 0.0 /100 | #317 | Tragic 6.4% |
| Comanche | 0.0 /100 | #318 | Tragic 6.4% |
| Delaware | 0.0 /100 | #319 | Tragic 6.5% |
Bermudan Disability Age 5 to 17 Correlation Summary
| Measurement | Bermudan Data | Disability Age 5 to 17 Data |
| Minimum | 0.0057% | 0.50% |
| Maximum | 13.0% | 26.8% |
| Range | 13.0% | 26.3% |
| Mean | 0.88% | 6.2% |
| Median | 0.46% | 6.2% |
| Interquartile 25% (IQ1) | 0.21% | 3.3% |
| Interquartile 75% (IQ3) | 0.88% | 7.9% |
| Interquartile Range (IQR) | 0.67% | 4.5% |
| Standard Deviation (Sample) | 1.9% | 4.3% |
| Standard Deviation (Population) | 1.9% | 4.3% |
Correlation Details
| Bermudan Percentile | Sample Size | Disability Age 5 to 17 |
[ 0.0% - 0.5% ] 0.0057% | 42,083,122 | 5.8% |
[ 0.0% - 0.5% ] 0.027% | 5,755,745 | 6.4% |
[ 0.0% - 0.5% ] 0.046% | 2,608,681 | 5.8% |
[ 0.0% - 0.5% ] 0.067% | 1,341,333 | 6.8% |
[ 0.0% - 0.5% ] 0.087% | 877,732 | 6.3% |
[ 0.0% - 0.5% ] 0.11% | 582,211 | 6.9% |
[ 0.0% - 0.5% ] 0.13% | 180,201 | 6.4% |
[ 0.0% - 0.5% ] 0.15% | 359,925 | 5.0% |
[ 0.0% - 0.5% ] 0.16% | 196,469 | 5.0% |
[ 0.0% - 0.5% ] 0.18% | 329,041 | 6.9% |
[ 0.0% - 0.5% ] 0.20% | 212,772 | 7.8% |
[ 0.0% - 0.5% ] 0.23% | 122,993 | 8.1% |
[ 0.0% - 0.5% ] 0.25% | 57,161 | 8.6% |
[ 0.0% - 0.5% ] 0.26% | 193,324 | 8.0% |
[ 0.0% - 0.5% ] 0.29% | 74,570 | 9.1% |
[ 0.0% - 0.5% ] 0.30% | 93,897 | 6.4% |
[ 0.0% - 0.5% ] 0.32% | 29,910 | 6.4% |
[ 0.0% - 0.5% ] 0.34% | 40,373 | 9.9% |
[ 0.0% - 0.5% ] 0.35% | 73,995 | 7.0% |
[ 0.0% - 0.5% ] 0.38% | 17,671 | 13.4% |
[ 0.0% - 0.5% ] 0.40% | 14,587 | 5.7% |
[ 0.0% - 0.5% ] 0.42% | 72,989 | 5.6% |
[ 0.0% - 0.5% ] 0.46% | 37,702 | 5.8% |
[ 0.0% - 0.5% ] 0.48% | 33,523 | 5.0% |
[ 0.0% - 0.5% ] 0.49% | 2,039 | 3.9% |
[ 0.5% - 1.0% ] 0.51% | 1,751 | 6.2% |
[ 0.5% - 1.0% ] 0.54% | 48,361 | 7.7% |
[ 0.5% - 1.0% ] 0.55% | 58,673 | 5.8% |
[ 0.5% - 1.0% ] 0.59% | 3,406 | 0.50% |
[ 0.5% - 1.0% ] 0.68% | 2,050 | 1.6% |
[ 0.5% - 1.0% ] 0.70% | 5,115 | 2.8% |
[ 0.5% - 1.0% ] 0.73% | 2,731 | 0.60% |
[ 0.5% - 1.0% ] 0.82% | 10,602 | 6.2% |
[ 0.5% - 1.0% ] 0.85% | 51,938 | 1.8% |
[ 0.5% - 1.0% ] 0.92% | 5,338 | 0.90% |
[ 0.5% - 1.0% ] 0.95% | 4,221 | 2.4% |
[ 1.0% - 1.5% ] 1.01% | 24,551 | 10.3% |
[ 1.0% - 1.5% ] 1.05% | 1,818 | 1.9% |
[ 1.0% - 1.5% ] 1.16% | 9,767 | 2.8% |
[ 1.0% - 1.5% ] 1.25% | 8,002 | 9.0% |
[ 1.0% - 1.5% ] 1.27% | 8,326 | 1.7% |
[ 1.5% - 2.0% ] 1.64% | 2,690 | 9.4% |
[ 2.0% - 2.5% ] 2.31% | 3,770 | 0.60% |
[ 2.5% - 3.0% ] 2.94% | 374 | 10.0% |
[ 12.5% - 13.0% ] 12.96% | 548 | 26.8% |