Puerto Rican Disability Age 5 to 17
COMPARE
Puerto Rican
Select to Compare
Disability Age 5 to 17
Puerto Rican Disability Age 5 to 17
8.3%
DISABILITY | AGE 5 TO 17
0.0/ 100
METRIC RATING
346th/ 347
METRIC RANK
Puerto Rican Disability Age 5 to 17 Correlation Chart
The statistical analysis conducted on geographies consisting of 520,259,876 people shows a moderate positive correlation between the proportion of Puerto Ricans and percentage of population with a disability between the ages 5 and 17 in the United States with a correlation coefficient (R) of 0.407 and weighted average of 8.3%. On average, for every 1% (one percent) increase in Puerto Ricans within a typical geography, there is an increase of 0.047% in percentage of population with a disability between the ages 5 and 17.
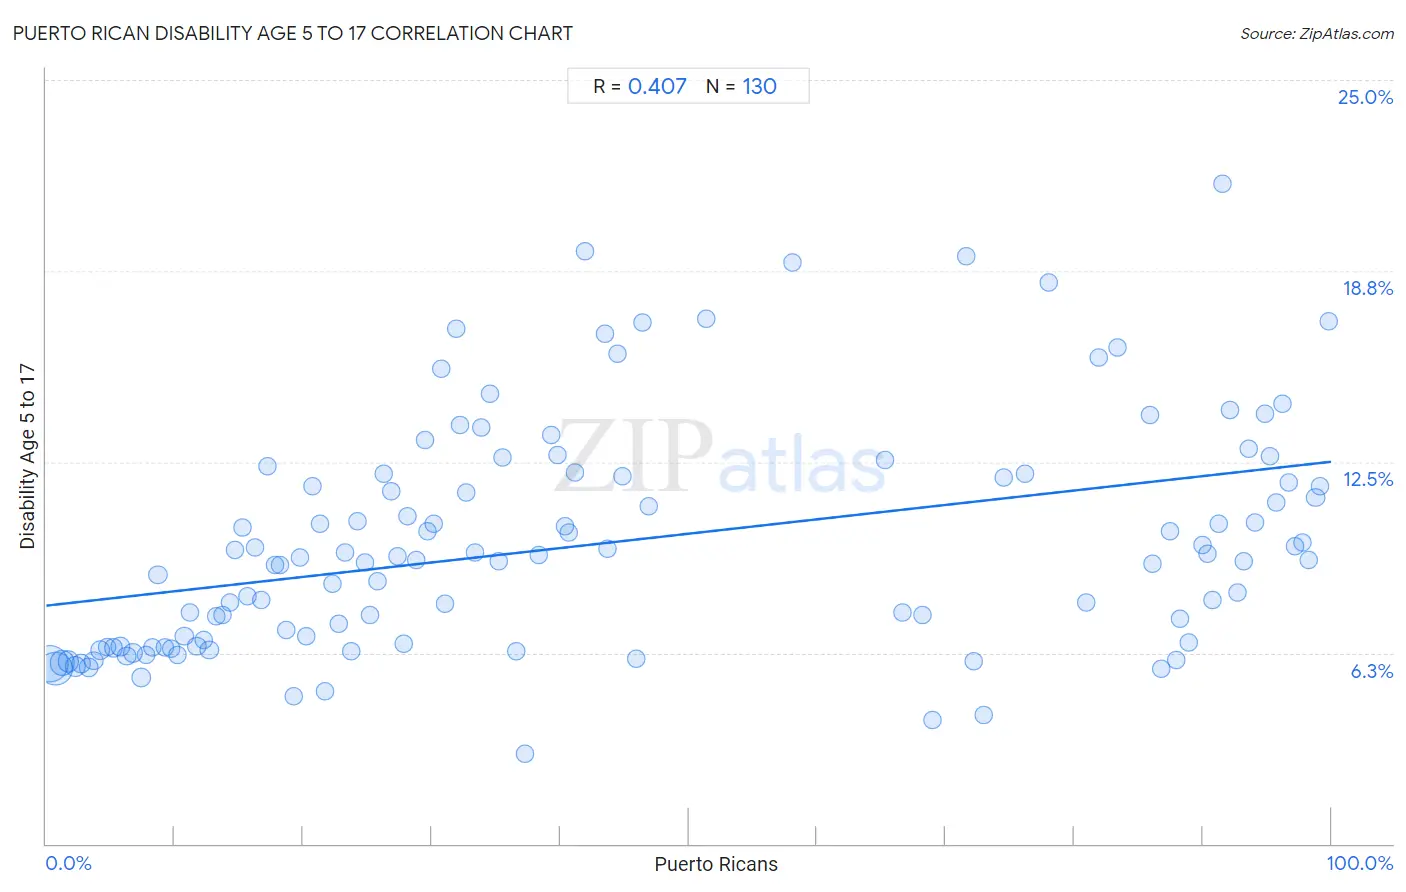
It is essential to understand that the correlation between the percentage of Puerto Ricans and percentage of population with a disability between the ages 5 and 17 does not imply a direct cause-and-effect relationship. It remains uncertain whether the presence of Puerto Ricans influences an upward or downward trend in the level of percentage of population with a disability between the ages 5 and 17 within an area, or if Puerto Ricans simply ended up residing in those areas with higher or lower levels of percentage of population with a disability between the ages 5 and 17 due to other factors.
Demographics Similar to Puerto Ricans by Disability Age 5 to 17
In terms of disability age 5 to 17, the demographic groups most similar to Puerto Ricans are Tsimshian (7.9%, a difference of 4.4%), Houma (9.1%, a difference of 9.3%), Cajun (7.2%, a difference of 15.3%), Immigrants from Cabo Verde (7.1%, a difference of 16.2%), and Chippewa (7.1%, a difference of 16.5%).
| Demographics | Rating | Rank | Disability Age 5 to 17 |
| Blacks/African Americans | 0.0 /100 | #333 | Tragic 6.8% |
| Seminole | 0.0 /100 | #334 | Tragic 6.8% |
| Ottawa | 0.0 /100 | #335 | Tragic 6.8% |
| Chickasaw | 0.0 /100 | #336 | Tragic 6.8% |
| Creek | 0.0 /100 | #337 | Tragic 6.9% |
| Iroquois | 0.0 /100 | #338 | Tragic 6.9% |
| Choctaw | 0.0 /100 | #339 | Tragic 6.9% |
| Cherokee | 0.0 /100 | #340 | Tragic 6.9% |
| Cape Verdeans | 0.0 /100 | #341 | Tragic 7.0% |
| Chippewa | 0.0 /100 | #342 | Tragic 7.1% |
| Immigrants from Cabo Verde | 0.0 /100 | #343 | Tragic 7.1% |
| Cajuns | 0.0 /100 | #344 | Tragic 7.2% |
| Tsimshian | 0.0 /100 | #345 | Tragic 7.9% |
| Puerto Ricans | 0.0 /100 | #346 | Tragic 8.3% |
| Houma | 0.0 /100 | #347 | Tragic 9.1% |
Puerto Rican Disability Age 5 to 17 Correlation Summary
| Measurement | Puerto Rican Data | Disability Age 5 to 17 Data |
| Minimum | 0.28% | 3.0% |
| Maximum | 99.8% | 21.6% |
| Range | 99.5% | 18.7% |
| Mean | 43.1% | 9.8% |
| Median | 32.4% | 9.3% |
| Interquartile 25% (IQ1) | 16.3% | 6.5% |
| Interquartile 75% (IQ3) | 76.2% | 12.0% |
| Interquartile Range (IQR) | 59.9% | 5.6% |
| Standard Deviation (Sample) | 32.5% | 3.8% |
| Standard Deviation (Population) | 32.4% | 3.7% |
Correlation Details
| Puerto Rican Percentile | Sample Size | Disability Age 5 to 17 |
[ 0.0% - 0.5% ] 0.28% | 166,595,997 | 5.9% |
[ 0.5% - 1.0% ] 0.72% | 135,258,638 | 5.7% |
[ 1.0% - 1.5% ] 1.22% | 59,760,359 | 5.9% |
[ 1.5% - 2.0% ] 1.73% | 29,710,141 | 6.0% |
[ 2.0% - 2.5% ] 2.23% | 17,457,546 | 5.8% |
[ 2.5% - 3.0% ] 2.74% | 13,888,795 | 5.9% |
[ 3.0% - 3.5% ] 3.29% | 12,741,363 | 5.8% |
[ 3.5% - 4.0% ] 3.72% | 9,988,737 | 6.0% |
[ 4.0% - 4.5% ] 4.23% | 7,127,592 | 6.3% |
[ 4.5% - 5.0% ] 4.75% | 6,870,375 | 6.4% |
[ 5.0% - 5.5% ] 5.22% | 4,610,838 | 6.4% |
[ 5.5% - 6.0% ] 5.75% | 4,714,147 | 6.5% |
[ 6.0% - 6.5% ] 6.26% | 3,481,544 | 6.2% |
[ 6.5% - 7.0% ] 6.75% | 3,399,573 | 6.2% |
[ 7.0% - 7.5% ] 7.43% | 11,131,826 | 5.5% |
[ 7.5% - 8.0% ] 7.78% | 2,205,294 | 6.2% |
[ 8.0% - 8.5% ] 8.25% | 2,045,583 | 6.4% |
[ 8.5% - 9.0% ] 8.68% | 3,938,369 | 8.8% |
[ 9.0% - 9.5% ] 9.25% | 2,091,044 | 6.4% |
[ 9.5% - 10.0% ] 9.71% | 1,954,569 | 6.4% |
[ 10.0% - 10.5% ] 10.24% | 839,804 | 6.2% |
[ 10.5% - 11.0% ] 10.75% | 1,482,266 | 6.8% |
[ 11.0% - 11.5% ] 11.21% | 870,059 | 7.6% |
[ 11.5% - 12.0% ] 11.72% | 803,009 | 6.5% |
[ 12.0% - 12.5% ] 12.21% | 628,400 | 6.7% |
[ 12.5% - 13.0% ] 12.69% | 759,154 | 6.4% |
[ 13.0% - 13.5% ] 13.21% | 574,805 | 7.4% |
[ 13.5% - 14.0% ] 13.68% | 420,930 | 7.5% |
[ 14.0% - 14.5% ] 14.30% | 778,597 | 7.9% |
[ 14.5% - 15.0% ] 14.70% | 819,692 | 9.6% |
[ 15.0% - 15.5% ] 15.31% | 150,182 | 10.4% |
[ 15.5% - 16.0% ] 15.70% | 860,994 | 8.1% |
[ 16.0% - 16.5% ] 16.26% | 430,785 | 9.7% |
[ 16.5% - 17.0% ] 16.77% | 525,311 | 8.0% |
[ 17.0% - 17.5% ] 17.25% | 237,913 | 12.4% |
[ 17.5% - 18.0% ] 17.82% | 304,345 | 9.1% |
[ 18.0% - 18.5% ] 18.16% | 367,931 | 9.1% |
[ 18.5% - 19.0% ] 18.64% | 188,643 | 7.0% |
[ 19.0% - 19.5% ] 19.26% | 193,750 | 4.8% |
[ 19.5% - 20.0% ] 19.76% | 216,329 | 9.4% |
[ 20.0% - 20.5% ] 20.23% | 91,525 | 6.8% |
[ 20.5% - 21.0% ] 20.69% | 354,862 | 11.7% |
[ 21.0% - 21.5% ] 21.28% | 320,217 | 10.5% |
[ 21.5% - 22.0% ] 21.70% | 146,836 | 5.0% |
[ 22.0% - 22.5% ] 22.26% | 69,958 | 8.5% |
[ 22.5% - 23.0% ] 22.78% | 154,070 | 7.2% |
[ 23.0% - 23.5% ] 23.26% | 256,004 | 9.5% |
[ 23.5% - 24.0% ] 23.76% | 53,772 | 6.3% |
[ 24.0% - 24.5% ] 24.21% | 192,047 | 10.5% |
[ 24.5% - 25.0% ] 24.79% | 39,678 | 9.2% |
[ 25.0% - 25.5% ] 25.17% | 73,219 | 7.5% |
[ 25.5% - 26.0% ] 25.78% | 294,946 | 8.6% |
[ 26.0% - 26.5% ] 26.24% | 113,185 | 12.1% |
[ 26.5% - 27.0% ] 26.82% | 211,727 | 11.5% |
[ 27.0% - 27.5% ] 27.29% | 115,635 | 9.4% |
[ 27.5% - 28.0% ] 27.85% | 84,562 | 6.5% |
[ 28.0% - 28.5% ] 28.10% | 207,807 | 10.7% |
[ 28.5% - 29.0% ] 28.75% | 138,273 | 9.3% |
[ 29.0% - 29.5% ] 29.43% | 88,180 | 13.2% |
[ 29.5% - 30.0% ] 29.69% | 118,990 | 10.2% |
[ 30.0% - 30.5% ] 30.12% | 46,402 | 10.5% |
[ 30.5% - 31.0% ] 30.79% | 28,965 | 15.6% |
[ 31.0% - 31.5% ] 31.05% | 50,450 | 7.9% |
[ 31.5% - 32.0% ] 31.94% | 127,342 | 16.9% |
[ 32.0% - 32.5% ] 32.18% | 62,567 | 13.7% |
[ 32.5% - 33.0% ] 32.66% | 154,688 | 11.5% |
[ 33.0% - 33.5% ] 33.32% | 121,057 | 9.5% |
[ 33.5% - 34.0% ] 33.83% | 74,212 | 13.6% |
[ 34.5% - 35.0% ] 34.57% | 71,241 | 14.7% |
[ 35.0% - 35.5% ] 35.17% | 26,615 | 9.2% |
[ 35.5% - 36.0% ] 35.53% | 13,479 | 12.7% |
[ 36.5% - 37.0% ] 36.60% | 68,321 | 6.3% |
[ 37.0% - 37.5% ] 37.23% | 19,353 | 3.0% |
[ 38.0% - 38.5% ] 38.35% | 16,024 | 9.5% |
[ 39.0% - 39.5% ] 39.30% | 194,833 | 13.4% |
[ 39.5% - 40.0% ] 39.75% | 51,640 | 12.7% |
[ 40.0% - 40.5% ] 40.34% | 76,094 | 10.4% |
[ 40.5% - 41.0% ] 40.69% | 69,311 | 10.2% |
[ 41.0% - 41.5% ] 41.13% | 44,030 | 12.1% |
[ 41.5% - 42.0% ] 41.93% | 60,229 | 19.4% |
[ 43.0% - 43.5% ] 43.47% | 8,418 | 16.7% |
[ 43.5% - 44.0% ] 43.72% | 70,222 | 9.6% |
[ 44.0% - 44.5% ] 44.43% | 25,642 | 16.1% |
[ 44.5% - 45.0% ] 44.86% | 43,664 | 12.0% |
[ 45.5% - 46.0% ] 45.93% | 34,257 | 6.0% |
[ 46.0% - 46.5% ] 46.38% | 276 | 17.1% |
[ 46.5% - 47.0% ] 46.89% | 77,830 | 11.0% |
[ 51.0% - 51.5% ] 51.41% | 22,606 | 17.2% |
[ 58.0% - 58.5% ] 58.07% | 12,443 | 19.0% |
[ 65.0% - 65.5% ] 65.24% | 12,045 | 12.6% |
[ 66.5% - 67.0% ] 66.64% | 17,495 | 7.6% |
[ 68.0% - 68.5% ] 68.15% | 7,087 | 7.5% |
[ 68.5% - 69.0% ] 68.99% | 8,220 | 4.1% |
[ 71.5% - 72.0% ] 71.61% | 701 | 19.2% |
[ 72.0% - 72.5% ] 72.22% | 24,713 | 6.0% |
[ 72.5% - 73.0% ] 72.96% | 5,955 | 4.2% |
[ 74.5% - 75.0% ] 74.52% | 5,260 | 12.0% |
[ 76.0% - 76.5% ] 76.20% | 17,293 | 12.1% |
[ 77.5% - 78.0% ] 77.98% | 16,890 | 18.4% |
[ 80.5% - 81.0% ] 80.95% | 16,607 | 7.9% |
[ 81.5% - 82.0% ] 81.92% | 553 | 15.9% |
[ 83.0% - 83.5% ] 83.33% | 3,233 | 16.2% |
[ 85.5% - 86.0% ] 85.93% | 37,109 | 14.0% |
[ 86.0% - 86.5% ] 86.12% | 341,160 | 9.1% |
[ 86.5% - 87.0% ] 86.74% | 40,064 | 5.7% |
[ 87.0% - 87.5% ] 87.45% | 16,451 | 10.2% |
[ 87.5% - 88.0% ] 87.90% | 4,562 | 6.0% |
[ 88.0% - 88.5% ] 88.19% | 40,300 | 7.4% |
[ 88.5% - 89.0% ] 88.88% | 7,068 | 6.6% |
[ 89.5% - 90.0% ] 89.97% | 13,876 | 9.8% |
[ 90.0% - 90.5% ] 90.35% | 146,989 | 9.5% |
[ 90.5% - 91.0% ] 90.80% | 32,781 | 8.0% |
[ 91.0% - 91.5% ] 91.24% | 180,985 | 10.5% |
[ 91.5% - 92.0% ] 91.58% | 606 | 21.6% |
[ 92.0% - 92.5% ] 92.08% | 51,004 | 14.2% |
[ 92.5% - 93.0% ] 92.66% | 25,542 | 8.2% |
[ 93.0% - 93.5% ] 93.15% | 108,145 | 9.2% |
[ 93.5% - 94.0% ] 93.62% | 28,322 | 12.9% |
[ 94.0% - 94.5% ] 94.10% | 281,717 | 10.5% |
[ 94.5% - 95.0% ] 94.81% | 235,271 | 14.1% |
[ 95.0% - 95.5% ] 95.25% | 310,643 | 12.7% |
[ 95.5% - 96.0% ] 95.73% | 148,599 | 11.2% |
[ 96.0% - 96.5% ] 96.18% | 318,068 | 14.4% |
[ 96.5% - 97.0% ] 96.73% | 349,511 | 11.8% |
[ 97.0% - 97.5% ] 97.19% | 193,983 | 9.7% |
[ 97.5% - 98.0% ] 97.73% | 515,616 | 9.9% |
[ 98.0% - 98.5% ] 98.27% | 361,701 | 9.3% |
[ 98.5% - 99.0% ] 98.78% | 498,872 | 11.3% |
[ 99.0% - 99.5% ] 99.16% | 440,345 | 11.7% |
[ 99.5% - 100.0% ] 99.77% | 171,601 | 17.1% |