Immigrants from Ethiopia Disability Age 5 to 17

COMPARE

Immigrants from Ethiopia
Race
Ancestry
AfghanAfricanAlaska NativeAlaskan AthabascanAlbanianAleutAlsatianAmericanApacheArabArapahoArgentineanArmenianAssyrian/Chaldean/SyriacAustralianAustrianBahamianBangladeshiBarbadianBasqueBelgianBelizeanBermudanBhutaneseBlackfeetBolivianBrazilianBritishBritish West IndianBulgarianBurmeseCajunCambodianCanadianCape VerdeanCarpatho RusynCelticCentral AmericanCentral American IndianCherokeeCheyenneChickasawChileanChineseChippewaChoctawColombianColvilleComancheCosta RicanCreeCreekCroatianCrowCubanCypriotCzechCzechoslovakianDanishDelawareDominicanDutchDutch West IndianEastern EuropeanEcuadorianEgyptianEnglishEstonianEthiopianEuropeanFijianFilipinoFinnishFrenchFrench American IndianFrench CanadianGermanGerman RussianGhanaianGreekGuamanian/ChamorroGuatemalanGuyaneseHaitianHmongHonduranHopiHoumaHungarianIcelanderIndian (Asian)IndonesianInupiatIranianIraqiIrishIroquoisIsraeliItalianJamaicanJapaneseJordanianKenyanKiowaKoreanLaotianLatvianLebaneseLiberianLithuanianLumbeeLuxembourgerMacedonianMalaysianMalteseMarshalleseMenomineeMexicanMexican American IndianMongolianMoroccanNative HawaiianNavajoNepaleseNew ZealanderNicaraguanNigerianNorthern EuropeanNorwegianOkinawanOsageOttawaPaiutePakistaniPalestinianPanamanianParaguayanPennsylvania GermanPeruvianPimaPolishPortuguesePotawatomiPuebloPuerto RicanPuget Sound SalishRomanianRussianSalvadoranSamoanScandinavianScotch-IrishScottishSeminoleSenegaleseSerbianShoshoneSierra LeoneanSiouxSlavicSlovakSloveneSomaliSouth AfricanSouth AmericanSouth American IndianSoviet UnionSpaniardSpanishSpanish AmericanSpanish American IndianSri LankanSubsaharan AfricanSudaneseSwedishSwissSyrianTaiwaneseThaiTlingit-HaidaTohono O'OdhamTonganTrinidadian and TobagonianTsimshianTurkishU.S. Virgin IslanderUgandanUkrainianUruguayanUteVenezuelanVietnameseWelshWest IndianYakamaYaquiYugoslavianYumanYup'ikZimbabwean
Immigration
NonimmigrantsImmigrantsAfghanistanAfricaAlbaniaArgentinaArmeniaAsiaAustraliaAustriaBahamasBangladeshBarbadosBelarusBelgiumBelizeBoliviaBosnia and HerzegovinaBrazilBulgariaBurma/MyanmarCabo VerdeCambodiaCameroonCanadaCaribbeanCentral AmericaChileChinaColombiaCongoCosta RicaCroatiaCubaCzechoslovakiaDenmarkDominicaDominican RepublicEastern AfricaEastern AsiaEastern EuropeEcuadorEgyptEl SalvadorEnglandEritreaEthiopiaEuropeFijiFranceGermanyGhanaGreeceGrenadaGuatemalaGuyanaHaitiHondurasHong KongHungaryIndiaIndonesiaIranIraqIrelandIsraelItalyJamaicaJapanJordanKazakhstanKenyaKoreaKuwaitLaosLatin AmericaLatviaLebanonLiberiaLithuaniaMalaysiaMexicoMicronesiaMiddle AfricaMoldovaMoroccoNepalNetherlandsNicaraguaNigeriaNorth AmericaNorth MacedoniaNorthern AfricaNorthern EuropeNorwayOceaniaPakistanPanamaPeruPhilippinesPolandPortugalRomaniaRussiaSaudi ArabiaScotlandSenegalSerbiaSierra LeoneSingaporeSomaliaSouth AfricaSouth AmericaSouth Central AsiaSouth Eastern AsiaSouthern EuropeSpainSri LankaSt. Vincent and the GrenadinesSudanSwedenSwitzerlandSyriaTaiwanThailandTrinidad and TobagoTurkeyUgandaUkraineUruguayUzbekistanVenezuelaVietnamWest IndiesWestern AfricaWestern AsiaWestern EuropeYemenZaireZimbabweAzores
Select to Compare
Race
Ancestry
AfghanAfricanAlaska NativeAlaskan AthabascanAlbanianAleutAlsatianAmericanApacheArabArapahoArgentineanArmenianAssyrian/Chaldean/SyriacAustralianAustrianBahamianBangladeshiBarbadianBasqueBelgianBelizeanBermudanBhutaneseBlackfeetBolivianBrazilianBritishBritish West IndianBulgarianBurmeseCajunCambodianCanadianCape VerdeanCarpatho RusynCelticCentral AmericanCentral American IndianCherokeeCheyenneChickasawChileanChineseChippewaChoctawColombianColvilleComancheCosta RicanCreeCreekCroatianCrowCubanCypriotCzechCzechoslovakianDanishDelawareDominicanDutchDutch West IndianEastern EuropeanEcuadorianEgyptianEnglishEstonianEthiopianEuropeanFijianFilipinoFinnishFrenchFrench American IndianFrench CanadianGermanGerman RussianGhanaianGreekGuamanian/ChamorroGuatemalanGuyaneseHaitianHmongHonduranHopiHoumaHungarianIcelanderIndian (Asian)IndonesianInupiatIranianIraqiIrishIroquoisIsraeliItalianJamaicanJapaneseJordanianKenyanKiowaKoreanLaotianLatvianLebaneseLiberianLithuanianLumbeeLuxembourgerMacedonianMalaysianMalteseMarshalleseMenomineeMexicanMexican American IndianMongolianMoroccanNative HawaiianNavajoNepaleseNew ZealanderNicaraguanNigerianNorthern EuropeanNorwegianOkinawanOsageOttawaPaiutePakistaniPalestinianPanamanianParaguayanPennsylvania GermanPeruvianPimaPolishPortuguesePotawatomiPuebloPuerto RicanPuget Sound SalishRomanianRussianSalvadoranSamoanScandinavianScotch-IrishScottishSeminoleSenegaleseSerbianShoshoneSierra LeoneanSiouxSlavicSlovakSloveneSomaliSouth AfricanSouth AmericanSouth American IndianSoviet UnionSpaniardSpanishSpanish AmericanSpanish American IndianSri LankanSubsaharan AfricanSudaneseSwedishSwissSyrianTaiwaneseThaiTlingit-HaidaTohono O'OdhamTonganTrinidadian and TobagonianTsimshianTurkishU.S. Virgin IslanderUgandanUkrainianUruguayanUteVenezuelanVietnameseWelshWest IndianYakamaYaquiYugoslavianYumanYup'ikZimbabwean
Immigration
NonimmigrantsImmigrantsAfghanistanAfricaAlbaniaArgentinaArmeniaAsiaAustraliaAustriaBahamasBangladeshBarbadosBelarusBelgiumBelizeBoliviaBosnia and HerzegovinaBrazilBulgariaBurma/MyanmarCabo VerdeCambodiaCameroonCanadaCaribbeanCentral AmericaChileChinaColombiaCongoCosta RicaCroatiaCubaCzechoslovakiaDenmarkDominicaDominican RepublicEastern AfricaEastern AsiaEastern EuropeEcuadorEgyptEl SalvadorEnglandEritreaEuropeFijiFranceGermanyGhanaGreeceGrenadaGuatemalaGuyanaHaitiHondurasHong KongHungaryIndiaIndonesiaIranIraqIrelandIsraelItalyJamaicaJapanJordanKazakhstanKenyaKoreaKuwaitLaosLatin AmericaLatviaLebanonLiberiaLithuaniaMalaysiaMexicoMicronesiaMiddle AfricaMoldovaMoroccoNepalNetherlandsNicaraguaNigeriaNorth AmericaNorth MacedoniaNorthern AfricaNorthern EuropeNorwayOceaniaPakistanPanamaPeruPhilippinesPolandPortugalRomaniaRussiaSaudi ArabiaScotlandSenegalSerbiaSierra LeoneSingaporeSomaliaSouth AfricaSouth AmericaSouth Central AsiaSouth Eastern AsiaSouthern EuropeSpainSri LankaSt. Vincent and the GrenadinesSudanSwedenSwitzerlandSyriaTaiwanThailandTrinidad and TobagoTurkeyUgandaUkraineUruguayUzbekistanVenezuelaVietnamWest IndiesWestern AfricaWestern AsiaWestern EuropeYemenZaireZimbabweAzores
Disability Age 5 to 17
Income
Poverty
Unemployment
Labor Participation
Family Structure
Vehicle Availability
Education Level
Disability

Immigrants from Ethiopia Disability Age 5 to 17
Exceptional

5.4%
DISABILITY | AGE 5 TO 17
95.5/ 100
METRIC RATING
123rd/ 347
METRIC RANK

Immigrants from Ethiopia Disability Age 5 to 17 Correlation Chart

The statistical analysis conducted on geographies consisting of 210,785,168 people shows a strong positive correlation between the proportion of Immigrants from Ethiopia and percentage of population with a disability between the ages 5 and 17 in the United States with a correlation coefficient (R) of 0.751 and weighted average of 5.4%. On average, for every 1% (one percent) increase in Immigrants from Ethiopia within a typical geography, there is an increase of 0.36% in percentage of population with a disability between the ages 5 and 17.
Immigrants from Ethiopia Disability Age 5 to 17
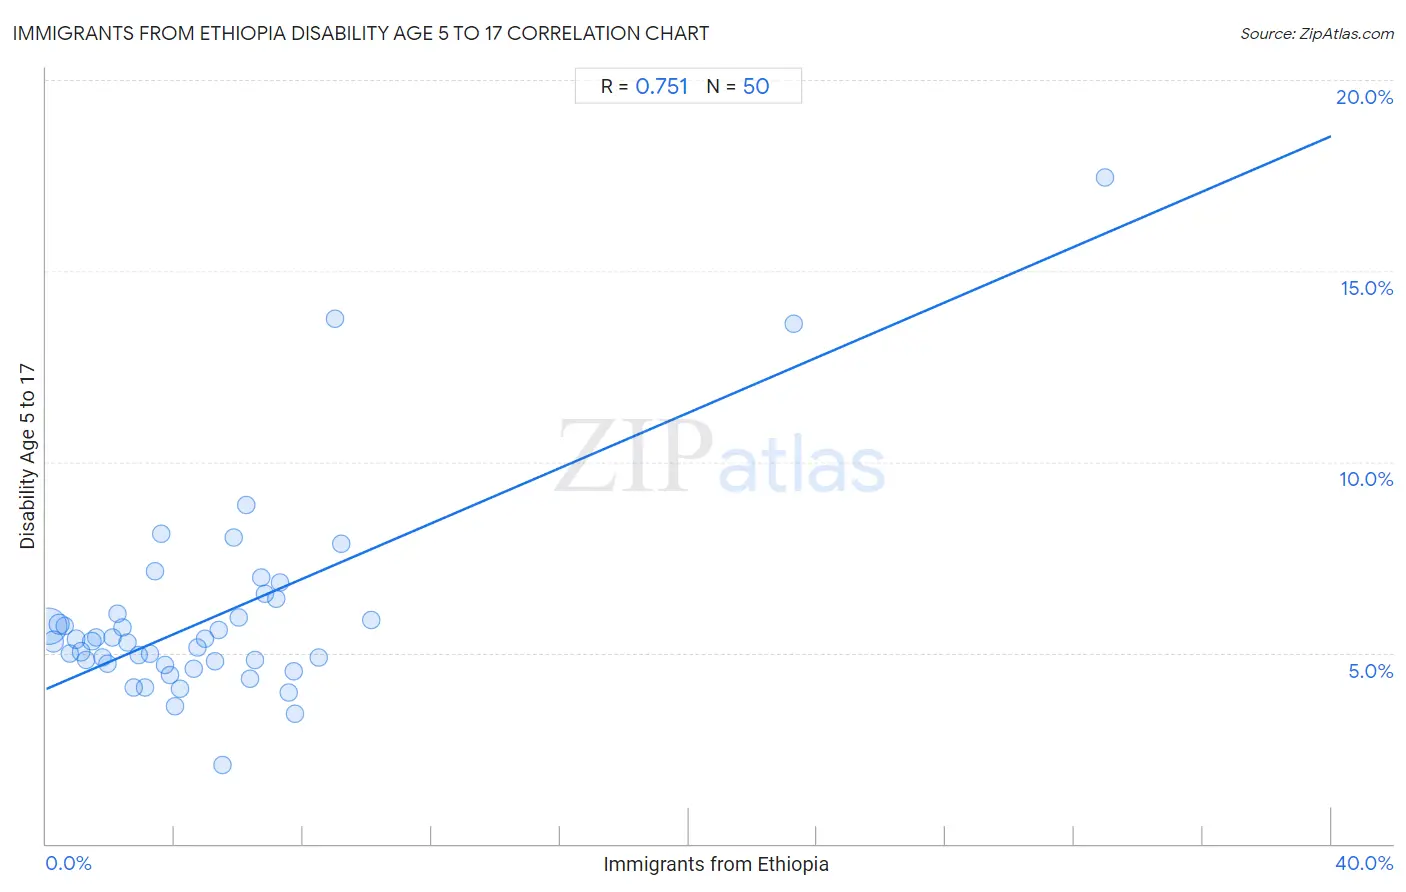
It is essential to understand that the correlation between the percentage of Immigrants from Ethiopia and percentage of population with a disability between the ages 5 and 17 does not imply a direct cause-and-effect relationship. It remains uncertain whether the presence of Immigrants from Ethiopia influences an upward or downward trend in the level of percentage of population with a disability between the ages 5 and 17 within an area, or if Immigrants from Ethiopia simply ended up residing in those areas with higher or lower levels of percentage of population with a disability between the ages 5 and 17 due to other factors.

Demographics Similar to Immigrants from Ethiopia by Disability Age 5 to 17

In terms of disability age 5 to 17, the demographic groups most similar to Immigrants from Ethiopia are Chilean (5.4%, a difference of 0.10%), Crow (5.4%, a difference of 0.13%), Immigrants from Chile (5.4%, a difference of 0.15%), Maltese (5.4%, a difference of 0.16%), and New Zealander (5.4%, a difference of 0.16%).
DemographicsRating | RankDisability Age 5 to 17
Cypriots
97.7
/100
|
#116
Exceptional
5.3%
Immigrants from Afghanistan
97.4
/100
|
#117
Exceptional
5.3%
South Americans
97.1
/100
|
#118
Exceptional
5.4%
Immigrants from South America
97.1
/100
|
#119
Exceptional
5.4%
Immigrants
97.0
/100
|
#120
Exceptional
5.4%
Maltese
96.0
/100
|
#121
Exceptional
5.4%
Chileans
95.8
/100
|
#122
Exceptional
5.4%
Immigrants from Ethiopia
95.5
/100
|
#123
Exceptional
5.4%
Crow
95.0
/100
|
#124
Exceptional
5.4%
Immigrants from Chile
95.0
/100
|
#125
Exceptional
5.4%
New Zealanders
95.0
/100
|
#126
Exceptional
5.4%
Latvians
95.0
/100
|
#127
Exceptional
5.4%
Immigrants from Venezuela
94.5
/100
|
#128
Exceptional
5.4%
Romanians
94.1
/100
|
#129
Exceptional
5.4%
Immigrants from Bulgaria
94.0
/100
|
#130
Exceptional
5.4%

Immigrants from Ethiopia Disability Age 5 to 17 Correlation Summary

MeasurementImmigrants from Ethiopia DataDisability Age 5 to 17 Data
Minimum0.061%2.1%
Maximum33.0%17.5%
Range32.9%15.4%
Mean5.2%5.9%
Median4.1%5.3%
Interquartile 25% (IQ1)2.1%4.7%
Interquartile 75% (IQ3)6.7%6.0%
Interquartile Range (IQR)4.6%1.3%
Standard Deviation (Sample)5.5%2.6%
Standard Deviation (Population)5.4%2.6%

Correlation Details

Immigrants from Ethiopia PercentileSample SizeDisability Age 5 to 17
[
0.0%
-
0.5%
]
0.061%
150,350,8395.7%
[
0.0%
-
0.5%
]
0.23%
25,118,2295.3%
[
0.0%
-
0.5%
]
0.41%
13,299,1885.7%
[
0.5%
-
1.0%
]
0.57%
4,681,6585.7%
[
0.5%
-
1.0%
]
0.73%
3,426,8305.0%
[
0.5%
-
1.0%
]
0.92%
2,558,7495.4%
[
1.0%
-
1.5%
]
1.08%
2,648,7375.0%
[
1.0%
-
1.5%
]
1.23%
1,590,0824.8%
[
1.0%
-
1.5%
]
1.42%
1,248,6635.3%
[
1.5%
-
2.0%
]
1.56%
967,2045.4%
[
1.5%
-
2.0%
]
1.73%
714,5674.9%
[
1.5%
-
2.0%
]
1.91%
434,0074.7%
[
2.0%
-
2.5%
]
2.07%
336,7585.4%
[
2.0%
-
2.5%
]
2.23%
194,8826.0%
[
2.0%
-
2.5%
]
2.38%
224,1475.7%
[
2.5%
-
3.0%
]
2.55%
255,7665.3%
[
2.5%
-
3.0%
]
2.72%
400,2004.1%
[
2.5%
-
3.0%
]
2.88%
291,6784.9%
[
3.0%
-
3.5%
]
3.06%
218,0554.1%
[
3.0%
-
3.5%
]
3.23%
166,0975.0%
[
3.0%
-
3.5%
]
3.40%
110,2297.1%
[
3.5%
-
4.0%
]
3.59%
50,5008.1%
[
3.5%
-
4.0%
]
3.71%
163,7834.7%
[
3.5%
-
4.0%
]
3.86%
263,0764.4%
[
3.5%
-
4.0%
]
4.00%
86,0293.6%
[
4.0%
-
4.5%
]
4.16%
33,8474.1%
[
4.5%
-
5.0%
]
4.60%
73,0744.6%
[
4.5%
-
5.0%
]
4.70%
75,8065.1%
[
4.5%
-
5.0%
]
4.95%
4,0235.4%
[
5.0%
-
5.5%
]
5.26%
25,3244.8%
[
5.0%
-
5.5%
]
5.37%
29,1325.6%
[
5.0%
-
5.5%
]
5.48%
11,2092.1%
[
5.5%
-
6.0%
]
5.85%
97,6618.0%
[
5.5%
-
6.0%
]
5.99%
152,9845.9%
[
6.0%
-
6.5%
]
6.24%
4,4258.9%
[
6.0%
-
6.5%
]
6.35%
56,7374.3%
[
6.5%
-
7.0%
]
6.51%
81,8084.8%
[
6.5%
-
7.0%
]
6.69%
73,2927.0%
[
6.5%
-
7.0%
]
6.82%
23,5056.5%
[
7.0%
-
7.5%
]
7.14%
75,5346.4%
[
7.0%
-
7.5%
]
7.28%
30,9276.8%
[
7.5%
-
8.0%
]
7.54%
17,5424.0%
[
7.5%
-
8.0%
]
7.71%
27,5234.5%
[
7.5%
-
8.0%
]
7.75%
37,2073.4%
[
8.0%
-
8.5%
]
8.50%
18,3244.9%
[
8.5%
-
9.0%
]
8.97%
53513.8%
[
9.0%
-
9.5%
]
9.17%
15,4897.9%
[
10.0%
-
10.5%
]
10.11%
14,5535.8%
[
23.0%
-
23.5%
]
23.25%
4,57213.6%
[
32.5%
-
33.0%
]
32.97%
18217.5%