Venezuelan Disability Age 5 to 17
COMPARE
Venezuelan
Select to Compare
Disability Age 5 to 17
Venezuelan Disability Age 5 to 17
5.4%
DISABILITY | AGE 5 TO 17
92.7/ 100
METRIC RATING
133rd/ 347
METRIC RANK
Venezuelan Disability Age 5 to 17 Correlation Chart
The statistical analysis conducted on geographies consisting of 304,670,804 people shows no correlation between the proportion of Venezuelans and percentage of population with a disability between the ages 5 and 17 in the United States with a correlation coefficient (R) of 0.050 and weighted average of 5.4%. On average, for every 1% (one percent) increase in Venezuelans within a typical geography, there is an increase of 0.066% in percentage of population with a disability between the ages 5 and 17.
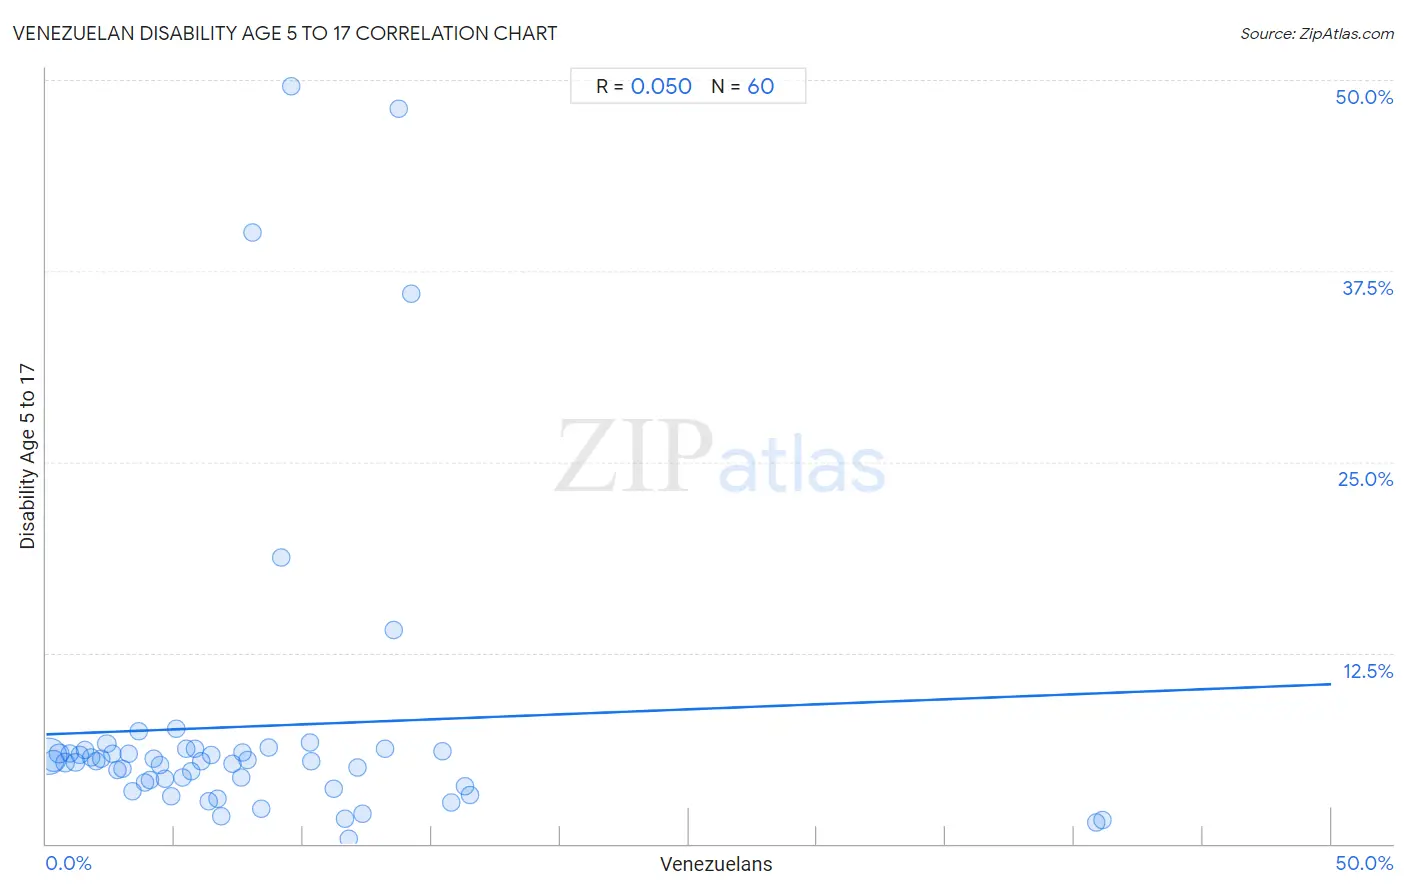
It is essential to understand that the correlation between the percentage of Venezuelans and percentage of population with a disability between the ages 5 and 17 does not imply a direct cause-and-effect relationship. It remains uncertain whether the presence of Venezuelans influences an upward or downward trend in the level of percentage of population with a disability between the ages 5 and 17 within an area, or if Venezuelans simply ended up residing in those areas with higher or lower levels of percentage of population with a disability between the ages 5 and 17 due to other factors.
Demographics Similar to Venezuelans by Disability Age 5 to 17
In terms of disability age 5 to 17, the demographic groups most similar to Venezuelans are Immigrants from Colombia (5.4%, a difference of 0.030%), Arab (5.4%, a difference of 0.050%), Yuman (5.4%, a difference of 0.080%), Immigrants from Belize (5.4%, a difference of 0.17%), and Immigrants from Denmark (5.4%, a difference of 0.22%).
| Demographics | Rating | Rank | Disability Age 5 to 17 |
| New Zealanders | 95.0 /100 | #126 | Exceptional 5.4% |
| Latvians | 95.0 /100 | #127 | Exceptional 5.4% |
| Immigrants from Venezuela | 94.5 /100 | #128 | Exceptional 5.4% |
| Romanians | 94.1 /100 | #129 | Exceptional 5.4% |
| Immigrants from Bulgaria | 94.0 /100 | #130 | Exceptional 5.4% |
| Arabs | 92.9 /100 | #131 | Exceptional 5.4% |
| Immigrants from Colombia | 92.9 /100 | #132 | Exceptional 5.4% |
| Venezuelans | 92.7 /100 | #133 | Exceptional 5.4% |
| Yuman | 92.3 /100 | #134 | Exceptional 5.4% |
| Immigrants from Belize | 91.7 /100 | #135 | Exceptional 5.4% |
| Immigrants from Denmark | 91.4 /100 | #136 | Exceptional 5.4% |
| Navajo | 90.9 /100 | #137 | Exceptional 5.4% |
| Immigrants from Oceania | 90.8 /100 | #138 | Exceptional 5.4% |
| Belizeans | 90.8 /100 | #139 | Exceptional 5.4% |
| Immigrants from Netherlands | 90.5 /100 | #140 | Exceptional 5.4% |
Venezuelan Disability Age 5 to 17 Correlation Summary
| Measurement | Venezuelan Data | Disability Age 5 to 17 Data |
| Minimum | 0.089% | 0.36% |
| Maximum | 41.1% | 49.6% |
| Range | 41.0% | 49.2% |
| Mean | 7.9% | 7.7% |
| Median | 6.2% | 5.4% |
| Interquartile 25% (IQ1) | 3.1% | 3.9% |
| Interquartile 75% (IQ3) | 10.8% | 6.1% |
| Interquartile Range (IQR) | 7.7% | 2.2% |
| Standard Deviation (Sample) | 7.7% | 10.1% |
| Standard Deviation (Population) | 7.6% | 10.0% |
Correlation Details
| Venezuelan Percentile | Sample Size | Disability Age 5 to 17 |
[ 0.0% - 0.5% ] 0.089% | 202,976,558 | 5.8% |
[ 0.0% - 0.5% ] 0.29% | 46,808,031 | 5.4% |
[ 0.5% - 1.0% ] 0.50% | 18,345,722 | 5.9% |
[ 0.5% - 1.0% ] 0.72% | 11,285,566 | 5.3% |
[ 0.5% - 1.0% ] 0.92% | 5,540,582 | 5.9% |
[ 1.0% - 1.5% ] 1.13% | 3,534,894 | 5.3% |
[ 1.0% - 1.5% ] 1.32% | 2,799,403 | 5.8% |
[ 1.5% - 2.0% ] 1.53% | 1,045,032 | 6.1% |
[ 1.5% - 2.0% ] 1.76% | 1,528,648 | 5.7% |
[ 1.5% - 2.0% ] 1.94% | 1,183,421 | 5.4% |
[ 2.0% - 2.5% ] 2.16% | 926,725 | 5.5% |
[ 2.0% - 2.5% ] 2.36% | 1,236,648 | 6.5% |
[ 2.5% - 3.0% ] 2.55% | 705,942 | 5.9% |
[ 2.5% - 3.0% ] 2.79% | 841,301 | 4.8% |
[ 2.5% - 3.0% ] 2.96% | 416,517 | 4.9% |
[ 3.0% - 3.5% ] 3.20% | 310,593 | 5.9% |
[ 3.0% - 3.5% ] 3.35% | 67,681 | 3.4% |
[ 3.5% - 4.0% ] 3.59% | 311,679 | 7.4% |
[ 3.5% - 4.0% ] 3.82% | 290,408 | 4.0% |
[ 4.0% - 4.5% ] 4.02% | 373,948 | 4.2% |
[ 4.0% - 4.5% ] 4.17% | 1,047,638 | 5.6% |
[ 4.0% - 4.5% ] 4.41% | 412,584 | 5.1% |
[ 4.5% - 5.0% ] 4.61% | 381,493 | 4.2% |
[ 4.5% - 5.0% ] 4.86% | 37,842 | 3.1% |
[ 5.0% - 5.5% ] 5.04% | 216,448 | 7.5% |
[ 5.0% - 5.5% ] 5.30% | 228,917 | 4.3% |
[ 5.0% - 5.5% ] 5.44% | 117,735 | 6.2% |
[ 5.5% - 6.0% ] 5.66% | 143,423 | 4.8% |
[ 5.5% - 6.0% ] 5.78% | 31,314 | 6.3% |
[ 6.0% - 6.5% ] 6.02% | 74,703 | 5.4% |
[ 6.0% - 6.5% ] 6.33% | 54,187 | 2.8% |
[ 6.0% - 6.5% ] 6.44% | 71,293 | 5.8% |
[ 6.5% - 7.0% ] 6.68% | 290,521 | 2.9% |
[ 6.5% - 7.0% ] 6.83% | 8,024 | 1.8% |
[ 7.0% - 7.5% ] 7.26% | 55,203 | 5.3% |
[ 7.5% - 8.0% ] 7.58% | 26,692 | 4.3% |
[ 7.5% - 8.0% ] 7.65% | 89,095 | 6.0% |
[ 7.5% - 8.0% ] 7.84% | 40,467 | 5.5% |
[ 8.0% - 8.5% ] 8.02% | 212 | 40.0% |
[ 8.0% - 8.5% ] 8.37% | 23,708 | 2.3% |
[ 8.5% - 9.0% ] 8.67% | 81,643 | 6.3% |
[ 9.0% - 9.5% ] 9.13% | 89,429 | 18.7% |
[ 9.5% - 10.0% ] 9.51% | 999 | 49.6% |
[ 10.0% - 10.5% ] 10.25% | 19,895 | 6.6% |
[ 10.0% - 10.5% ] 10.34% | 57,327 | 5.4% |
[ 11.0% - 11.5% ] 11.18% | 121,078 | 3.6% |
[ 11.5% - 12.0% ] 11.61% | 14,557 | 1.7% |
[ 11.5% - 12.0% ] 11.77% | 1,810 | 0.36% |
[ 12.0% - 12.5% ] 12.10% | 20,034 | 5.0% |
[ 12.0% - 12.5% ] 12.28% | 26,021 | 1.9% |
[ 13.0% - 13.5% ] 13.17% | 22,540 | 6.2% |
[ 13.5% - 14.0% ] 13.53% | 54,464 | 14.0% |
[ 13.5% - 14.0% ] 13.71% | 1,794 | 48.1% |
[ 14.0% - 14.5% ] 14.19% | 1,057 | 36.0% |
[ 15.0% - 15.5% ] 15.42% | 68,029 | 6.0% |
[ 15.5% - 16.0% ] 15.77% | 11,809 | 2.7% |
[ 16.0% - 16.5% ] 16.28% | 31,514 | 3.8% |
[ 16.0% - 16.5% ] 16.50% | 26,364 | 3.2% |
[ 40.5% - 41.0% ] 40.84% | 64,751 | 1.4% |
[ 41.0% - 41.5% ] 41.11% | 74,891 | 1.6% |