Tlingit-Haida Family Households

COMPARE

Tlingit-Haida
Race
Ancestry
AfghanAfricanAlaska NativeAlaskan AthabascanAlbanianAleutAlsatianAmericanApacheArabArapahoArgentineanArmenianAssyrian/Chaldean/SyriacAustralianAustrianBahamianBangladeshiBarbadianBasqueBelgianBelizeanBermudanBhutaneseBlackfeetBolivianBrazilianBritishBritish West IndianBulgarianBurmeseCajunCambodianCanadianCape VerdeanCarpatho RusynCelticCentral AmericanCentral American IndianCherokeeCheyenneChickasawChileanChineseChippewaChoctawColombianColvilleComancheCosta RicanCreeCreekCroatianCrowCubanCypriotCzechCzechoslovakianDanishDelawareDominicanDutchDutch West IndianEastern EuropeanEcuadorianEgyptianEnglishEstonianEthiopianEuropeanFijianFilipinoFinnishFrenchFrench American IndianFrench CanadianGermanGerman RussianGhanaianGreekGuamanian/ChamorroGuatemalanGuyaneseHaitianHmongHonduranHopiHoumaHungarianIcelanderIndian (Asian)IndonesianInupiatIranianIraqiIrishIroquoisIsraeliItalianJamaicanJapaneseJordanianKenyanKiowaKoreanLaotianLatvianLebaneseLiberianLithuanianLumbeeLuxembourgerMacedonianMalaysianMalteseMarshalleseMenomineeMexicanMexican American IndianMongolianMoroccanNative HawaiianNavajoNepaleseNew ZealanderNicaraguanNigerianNorthern EuropeanNorwegianOkinawanOsageOttawaPaiutePakistaniPalestinianPanamanianParaguayanPennsylvania GermanPeruvianPimaPolishPortuguesePotawatomiPuebloPuerto RicanPuget Sound SalishRomanianRussianSalvadoranSamoanScandinavianScotch-IrishScottishSeminoleSenegaleseSerbianShoshoneSierra LeoneanSiouxSlavicSlovakSloveneSomaliSouth AfricanSouth AmericanSouth American IndianSoviet UnionSpaniardSpanishSpanish AmericanSpanish American IndianSri LankanSubsaharan AfricanSudaneseSwedishSwissSyrianTaiwaneseThaiTlingit-HaidaTohono O'OdhamTonganTrinidadian and TobagonianTsimshianTurkishU.S. Virgin IslanderUgandanUkrainianUruguayanUteVenezuelanVietnameseWelshWest IndianYakamaYaquiYugoslavianYumanYup'ikZimbabwean
Immigration
NonimmigrantsImmigrantsAfghanistanAfricaAlbaniaArgentinaArmeniaAsiaAustraliaAustriaBahamasBangladeshBarbadosBelarusBelgiumBelizeBoliviaBosnia and HerzegovinaBrazilBulgariaBurma/MyanmarCabo VerdeCambodiaCameroonCanadaCaribbeanCentral AmericaChileChinaColombiaCongoCosta RicaCroatiaCubaCzechoslovakiaDenmarkDominicaDominican RepublicEastern AfricaEastern AsiaEastern EuropeEcuadorEgyptEl SalvadorEnglandEritreaEthiopiaEuropeFijiFranceGermanyGhanaGreeceGrenadaGuatemalaGuyanaHaitiHondurasHong KongHungaryIndiaIndonesiaIranIraqIrelandIsraelItalyJamaicaJapanJordanKazakhstanKenyaKoreaKuwaitLaosLatin AmericaLatviaLebanonLiberiaLithuaniaMalaysiaMexicoMicronesiaMiddle AfricaMoldovaMoroccoNepalNetherlandsNicaraguaNigeriaNorth AmericaNorth MacedoniaNorthern AfricaNorthern EuropeNorwayOceaniaPakistanPanamaPeruPhilippinesPolandPortugalRomaniaRussiaSaudi ArabiaScotlandSenegalSerbiaSierra LeoneSingaporeSomaliaSouth AfricaSouth AmericaSouth Central AsiaSouth Eastern AsiaSouthern EuropeSpainSri LankaSt. Vincent and the GrenadinesSudanSwedenSwitzerlandSyriaTaiwanThailandTrinidad and TobagoTurkeyUgandaUkraineUruguayUzbekistanVenezuelaVietnamWest IndiesWestern AfricaWestern AsiaWestern EuropeYemenZaireZimbabweAzores
Select to Compare
Race
Ancestry
AfghanAfricanAlaska NativeAlaskan AthabascanAlbanianAleutAlsatianAmericanApacheArabArapahoArgentineanArmenianAssyrian/Chaldean/SyriacAustralianAustrianBahamianBangladeshiBarbadianBasqueBelgianBelizeanBermudanBhutaneseBlackfeetBolivianBrazilianBritishBritish West IndianBulgarianBurmeseCajunCambodianCanadianCape VerdeanCarpatho RusynCelticCentral AmericanCentral American IndianCherokeeCheyenneChickasawChileanChineseChippewaChoctawColombianColvilleComancheCosta RicanCreeCreekCroatianCrowCubanCypriotCzechCzechoslovakianDanishDelawareDominicanDutchDutch West IndianEastern EuropeanEcuadorianEgyptianEnglishEstonianEthiopianEuropeanFijianFilipinoFinnishFrenchFrench American IndianFrench CanadianGermanGerman RussianGhanaianGreekGuamanian/ChamorroGuatemalanGuyaneseHaitianHmongHonduranHopiHoumaHungarianIcelanderIndian (Asian)IndonesianInupiatIranianIraqiIrishIroquoisIsraeliItalianJamaicanJapaneseJordanianKenyanKiowaKoreanLaotianLatvianLebaneseLiberianLithuanianLumbeeLuxembourgerMacedonianMalaysianMalteseMarshalleseMenomineeMexicanMexican American IndianMongolianMoroccanNative HawaiianNavajoNepaleseNew ZealanderNicaraguanNigerianNorthern EuropeanNorwegianOkinawanOsageOttawaPaiutePakistaniPalestinianPanamanianParaguayanPennsylvania GermanPeruvianPimaPolishPortuguesePotawatomiPuebloPuerto RicanPuget Sound SalishRomanianRussianSalvadoranSamoanScandinavianScotch-IrishScottishSeminoleSenegaleseSerbianShoshoneSierra LeoneanSiouxSlavicSlovakSloveneSomaliSouth AfricanSouth AmericanSouth American IndianSoviet UnionSpaniardSpanishSpanish AmericanSpanish American IndianSri LankanSubsaharan AfricanSudaneseSwedishSwissSyrianTaiwaneseThaiTohono O'OdhamTonganTrinidadian and TobagonianTsimshianTurkishU.S. Virgin IslanderUgandanUkrainianUruguayanUteVenezuelanVietnameseWelshWest IndianYakamaYaquiYugoslavianYumanYup'ikZimbabwean
Immigration
NonimmigrantsImmigrantsAfghanistanAfricaAlbaniaArgentinaArmeniaAsiaAustraliaAustriaBahamasBangladeshBarbadosBelarusBelgiumBelizeBoliviaBosnia and HerzegovinaBrazilBulgariaBurma/MyanmarCabo VerdeCambodiaCameroonCanadaCaribbeanCentral AmericaChileChinaColombiaCongoCosta RicaCroatiaCubaCzechoslovakiaDenmarkDominicaDominican RepublicEastern AfricaEastern AsiaEastern EuropeEcuadorEgyptEl SalvadorEnglandEritreaEthiopiaEuropeFijiFranceGermanyGhanaGreeceGrenadaGuatemalaGuyanaHaitiHondurasHong KongHungaryIndiaIndonesiaIranIraqIrelandIsraelItalyJamaicaJapanJordanKazakhstanKenyaKoreaKuwaitLaosLatin AmericaLatviaLebanonLiberiaLithuaniaMalaysiaMexicoMicronesiaMiddle AfricaMoldovaMoroccoNepalNetherlandsNicaraguaNigeriaNorth AmericaNorth MacedoniaNorthern AfricaNorthern EuropeNorwayOceaniaPakistanPanamaPeruPhilippinesPolandPortugalRomaniaRussiaSaudi ArabiaScotlandSenegalSerbiaSierra LeoneSingaporeSomaliaSouth AfricaSouth AmericaSouth Central AsiaSouth Eastern AsiaSouthern EuropeSpainSri LankaSt. Vincent and the GrenadinesSudanSwedenSwitzerlandSyriaTaiwanThailandTrinidad and TobagoTurkeyUgandaUkraineUruguayUzbekistanVenezuelaVietnamWest IndiesWestern AfricaWestern AsiaWestern EuropeYemenZaireZimbabweAzores
Family Households
Income
Poverty
Unemployment
Labor Participation
Family Structure
Vehicle Availability
Education Level
Disability

Tlingit-Haida Family Households
Tragic

61.6%
FAMILY HOUSEHOLDS
0.0/ 100
METRIC RATING
323rd/ 347
METRIC RANK

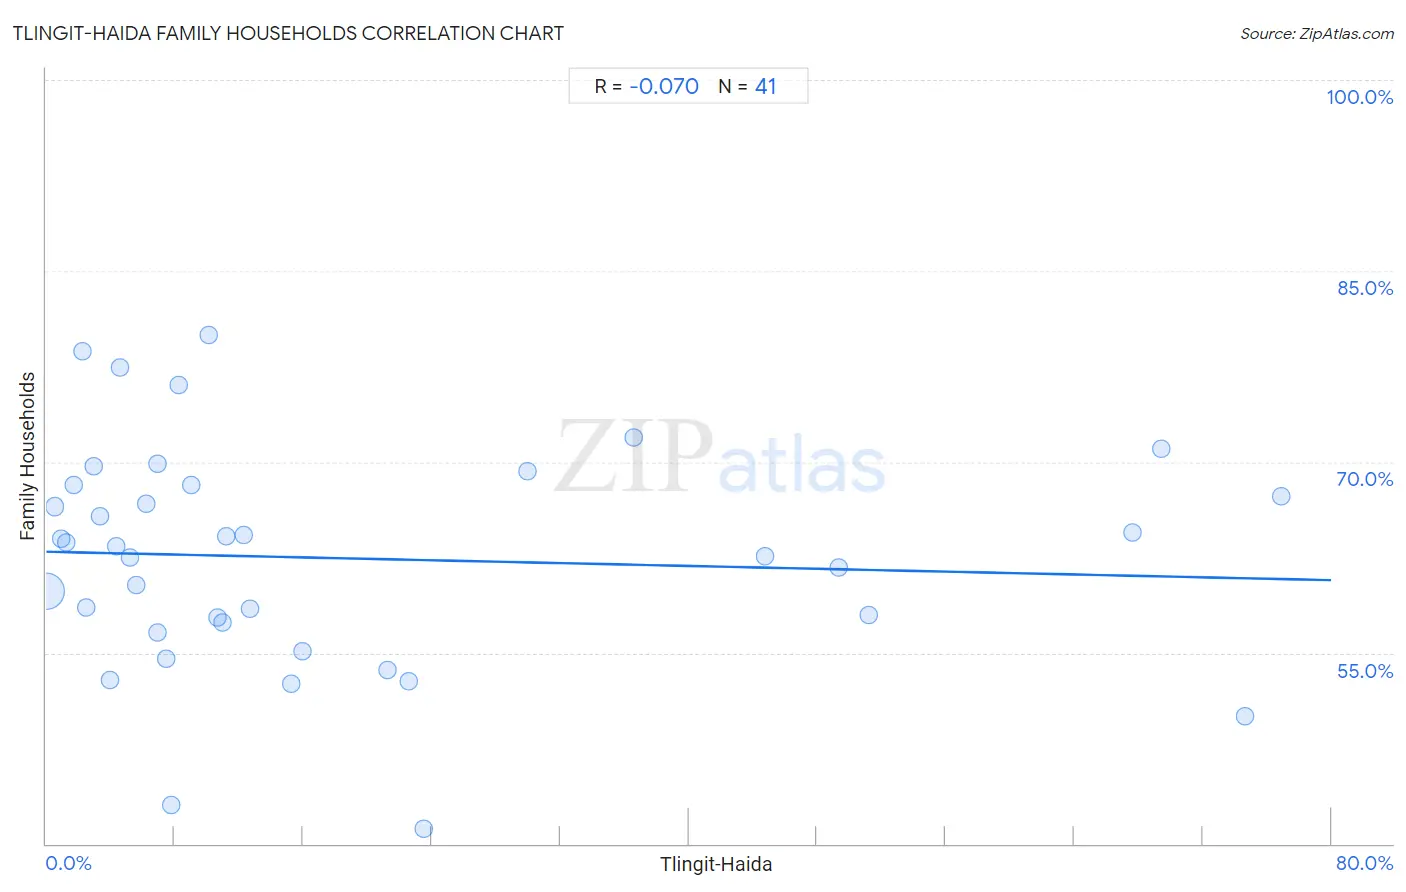
Tlingit-Haida Family Households Correlation Chart

The statistical analysis conducted on geographies consisting of 60,855,548 people shows a slight negative correlation between the proportion of Tlingit-Haida and percentage of family households in the United States with a correlation coefficient (R) of -0.070 and weighted average of 61.6%. On average, for every 1% (one percent) increase in Tlingit-Haida within a typical geography, there is a decrease of 0.028% in percentage of family households.
Tlingit-Haida Family Households
It is essential to understand that the correlation between the percentage of Tlingit-Haida and percentage of family households does not imply a direct cause-and-effect relationship. It remains uncertain whether the presence of Tlingit-Haida influences an upward or downward trend in the level of percentage of family households within an area, or if Tlingit-Haida simply ended up residing in those areas with higher or lower levels of percentage of family households due to other factors.

Demographics Similar to Tlingit-Haida by Family Households

In terms of family households, the demographic groups most similar to Tlingit-Haida are Immigrants from Serbia (61.6%, a difference of 0.010%), Immigrants from West Indies (61.6%, a difference of 0.010%), Immigrants from Switzerland (61.6%, a difference of 0.020%), Alsatian (61.7%, a difference of 0.10%), and Ugandan (61.7%, a difference of 0.15%).
DemographicsRating | RankFamily Households
Immigrants from Middle Africa
0.0
/100
|
#316
Tragic
61.9%
Immigrants from Bosnia and Herzegovina
0.0
/100
|
#317
Tragic
61.9%
Alaskan Athabascans
0.0
/100
|
#318
Tragic
61.8%
Cape Verdeans
0.0
/100
|
#319
Tragic
61.8%
Ugandans
0.0
/100
|
#320
Tragic
61.7%
Alsatians
0.0
/100
|
#321
Tragic
61.7%
Immigrants from Serbia
0.0
/100
|
#322
Tragic
61.6%
Tlingit-Haida
0.0
/100
|
#323
Tragic
61.6%
Immigrants from West Indies
0.0
/100
|
#324
Tragic
61.6%
Immigrants from Switzerland
0.0
/100
|
#325
Tragic
61.6%
Indonesians
0.0
/100
|
#326
Tragic
61.5%
Blacks/African Americans
0.0
/100
|
#327
Tragic
61.5%
Kiowa
0.0
/100
|
#328
Tragic
61.4%
Cambodians
0.0
/100
|
#329
Tragic
61.4%
Immigrants from Australia
0.0
/100
|
#330
Tragic
61.3%

Tlingit-Haida Family Households Correlation Summary

MeasurementTlingit-Haida DataFamily Households Data
Minimum0.036%41.2%
Maximum76.8%80.0%
Range76.8%38.8%
Mean18.5%62.4%
Median9.0%63.4%
Interquartile 25% (IQ1)4.2%57.0%
Interquartile 75% (IQ3)23.0%68.2%
Interquartile Range (IQR)18.9%11.2%
Standard Deviation (Sample)22.1%8.7%
Standard Deviation (Population)21.8%8.6%

Correlation Details

Tlingit-Haida PercentileSample SizeFamily Households
[
0.0%
-
0.5%
]
0.036%
59,016,73559.8%
[
0.5%
-
1.0%
]
0.54%
1,312,33966.5%
[
0.5%
-
1.0%
]
0.91%
247,81863.9%
[
1.0%
-
1.5%
]
1.24%
85,68763.6%
[
1.5%
-
2.0%
]
1.71%
25,68568.2%
[
2.0%
-
2.5%
]
2.28%
8,44778.7%
[
2.0%
-
2.5%
]
2.46%
3,65558.6%
[
2.5%
-
3.0%
]
2.92%
6,23169.6%
[
3.0%
-
3.5%
]
3.33%
10,38865.7%
[
3.5%
-
4.0%
]
3.97%
1,96452.8%
[
4.0%
-
4.5%
]
4.35%
11563.4%
[
4.5%
-
5.0%
]
4.62%
82277.4%
[
5.0%
-
5.5%
]
5.24%
42062.5%
[
5.5%
-
6.0%
]
5.62%
1,76260.3%
[
6.0%
-
6.5%
]
6.21%
17766.7%
[
6.5%
-
7.0%
]
6.91%
56469.9%
[
6.5%
-
7.0%
]
6.94%
2,14656.6%
[
7.0%
-
7.5%
]
7.50%
4054.5%
[
7.5%
-
8.0%
]
7.80%
1,25743.0%
[
8.0%
-
8.5%
]
8.22%
14676.0%
[
8.5%
-
9.0%
]
9.00%
6,69168.2%
[
10.0%
-
10.5%
]
10.13%
2,90280.0%
[
10.5%
-
11.0%
]
10.70%
29,93357.8%
[
11.0%
-
11.5%
]
11.00%
32,10857.4%
[
11.0%
-
11.5%
]
11.18%
13,91364.2%
[
12.0%
-
12.5%
]
12.26%
18,04164.3%
[
12.5%
-
13.0%
]
12.66%
8,64758.4%
[
15.0%
-
15.5%
]
15.26%
2,16952.6%
[
15.5%
-
16.0%
]
15.92%
1,72755.1%
[
21.0%
-
21.5%
]
21.23%
4,26753.7%
[
22.5%
-
23.0%
]
22.55%
1,07352.8%
[
23.5%
-
24.0%
]
23.53%
8541.2%
[
29.5%
-
30.0%
]
29.96%
1,12869.3%
[
36.5%
-
37.0%
]
36.59%
8271.9%
[
44.5%
-
45.0%
]
44.78%
92062.6%
[
49.0%
-
49.5%
]
49.33%
1,79261.7%
[
51.0%
-
51.5%
]
51.24%
80458.0%
[
67.5%
-
68.0%
]
67.59%
36164.4%
[
69.0%
-
69.5%
]
69.41%
1,60271.1%
[
74.5%
-
75.0%
]
74.63%
6750.0%
[
76.5%
-
77.0%
]
76.85%
83867.3%