Salvadoran Disability Age 5 to 17
COMPARE
Salvadoran
Select to Compare
Disability Age 5 to 17
Salvadoran Disability Age 5 to 17
5.3%
DISABILITY | AGE 5 TO 17
98.6/ 100
METRIC RATING
103rd/ 347
METRIC RANK
Salvadoran Disability Age 5 to 17 Correlation Chart
The statistical analysis conducted on geographies consisting of 396,298,472 people shows a poor negative correlation between the proportion of Salvadorans and percentage of population with a disability between the ages 5 and 17 in the United States with a correlation coefficient (R) of -0.144 and weighted average of 5.3%. On average, for every 1% (one percent) increase in Salvadorans within a typical geography, there is a decrease of 0.026% in percentage of population with a disability between the ages 5 and 17.
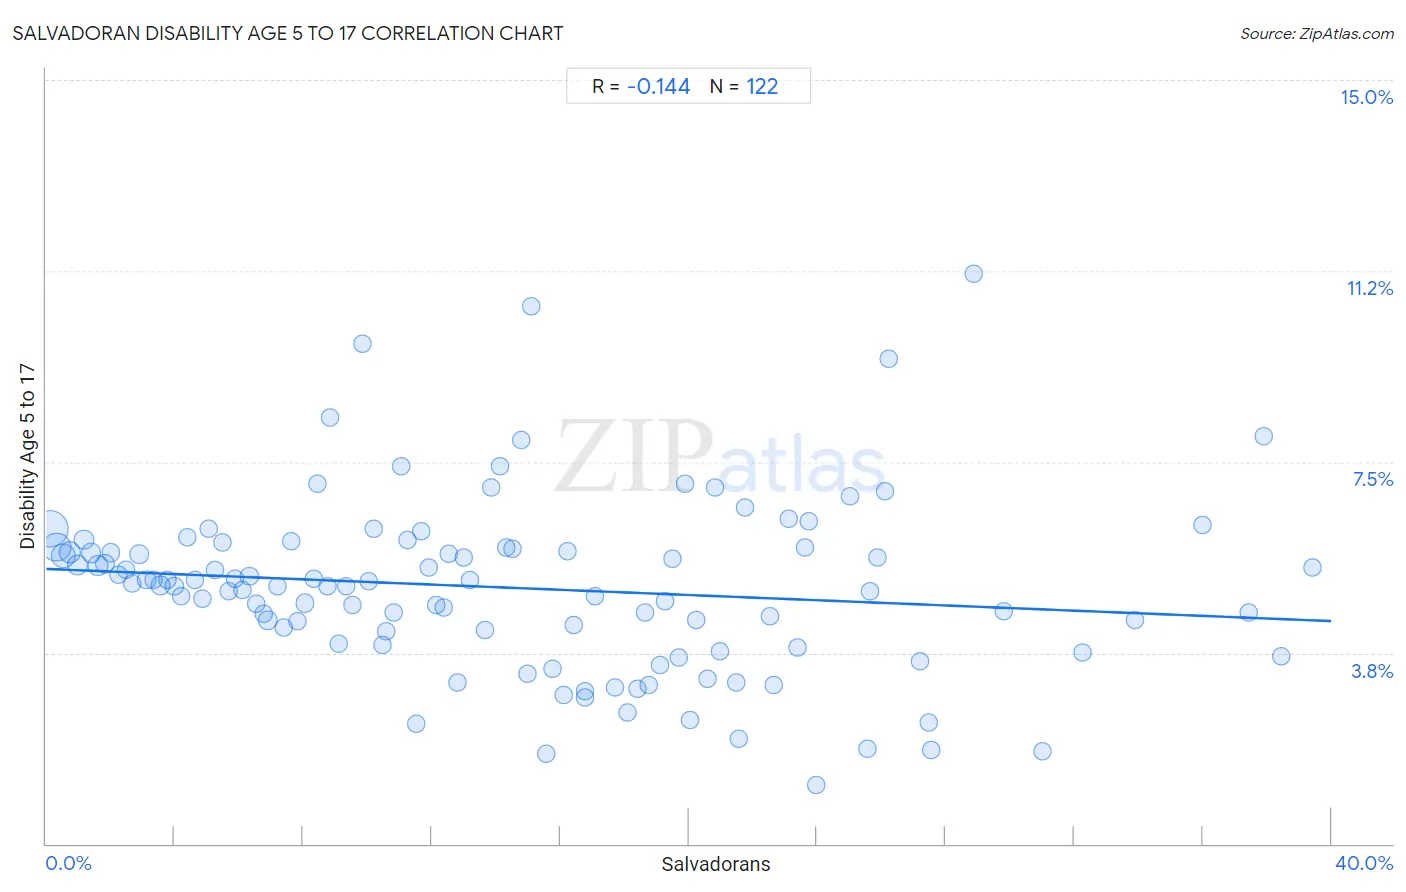
It is essential to understand that the correlation between the percentage of Salvadorans and percentage of population with a disability between the ages 5 and 17 does not imply a direct cause-and-effect relationship. It remains uncertain whether the presence of Salvadorans influences an upward or downward trend in the level of percentage of population with a disability between the ages 5 and 17 within an area, or if Salvadorans simply ended up residing in those areas with higher or lower levels of percentage of population with a disability between the ages 5 and 17 due to other factors.
Demographics Similar to Salvadorans by Disability Age 5 to 17
In terms of disability age 5 to 17, the demographic groups most similar to Salvadorans are Nicaraguan (5.3%, a difference of 0.030%), Peruvian (5.3%, a difference of 0.070%), Menominee (5.3%, a difference of 0.11%), Nepalese (5.3%, a difference of 0.13%), and Immigrants from Italy (5.3%, a difference of 0.17%).
| Demographics | Rating | Rank | Disability Age 5 to 17 |
| Immigrants from El Salvador | 99.0 /100 | #96 | Exceptional 5.3% |
| Immigrants from Europe | 99.0 /100 | #97 | Exceptional 5.3% |
| Immigrants from Austria | 98.9 /100 | #98 | Exceptional 5.3% |
| Cambodians | 98.8 /100 | #99 | Exceptional 5.3% |
| Nepalese | 98.7 /100 | #100 | Exceptional 5.3% |
| Menominee | 98.7 /100 | #101 | Exceptional 5.3% |
| Nicaraguans | 98.6 /100 | #102 | Exceptional 5.3% |
| Salvadorans | 98.6 /100 | #103 | Exceptional 5.3% |
| Peruvians | 98.5 /100 | #104 | Exceptional 5.3% |
| Immigrants from Italy | 98.4 /100 | #105 | Exceptional 5.3% |
| Immigrants from Yemen | 98.2 /100 | #106 | Exceptional 5.3% |
| Russians | 98.2 /100 | #107 | Exceptional 5.3% |
| Immigrants from South Africa | 98.1 /100 | #108 | Exceptional 5.3% |
| Immigrants from Northern Africa | 98.1 /100 | #109 | Exceptional 5.3% |
| Immigrants from Eritrea | 98.0 /100 | #110 | Exceptional 5.3% |
Salvadoran Disability Age 5 to 17 Correlation Summary
| Measurement | Salvadoran Data | Disability Age 5 to 17 Data |
| Minimum | 0.098% | 1.2% |
| Maximum | 39.4% | 11.2% |
| Range | 39.3% | 10.0% |
| Mean | 14.4% | 5.0% |
| Median | 13.1% | 5.1% |
| Interquartile 25% (IQ1) | 6.6% | 3.9% |
| Interquartile 75% (IQ3) | 20.8% | 5.8% |
| Interquartile Range (IQR) | 14.3% | 1.9% |
| Standard Deviation (Sample) | 9.6% | 1.7% |
| Standard Deviation (Population) | 9.6% | 1.7% |
Correlation Details
| Salvadoran Percentile | Sample Size | Disability Age 5 to 17 |
[ 0.0% - 0.5% ] 0.098% | 129,472,825 | 6.2% |
[ 0.0% - 0.5% ] 0.31% | 74,039,548 | 5.8% |
[ 0.5% - 1.0% ] 0.54% | 48,639,449 | 5.7% |
[ 0.5% - 1.0% ] 0.74% | 28,971,188 | 5.7% |
[ 0.5% - 1.0% ] 0.97% | 17,011,549 | 5.5% |
[ 1.0% - 1.5% ] 1.17% | 13,448,303 | 6.0% |
[ 1.0% - 1.5% ] 1.40% | 10,423,104 | 5.7% |
[ 1.5% - 2.0% ] 1.61% | 10,257,319 | 5.5% |
[ 1.5% - 2.0% ] 1.82% | 8,074,536 | 5.5% |
[ 2.0% - 2.5% ] 2.01% | 5,978,369 | 5.7% |
[ 2.0% - 2.5% ] 2.24% | 4,549,838 | 5.3% |
[ 2.0% - 2.5% ] 2.48% | 4,295,956 | 5.4% |
[ 2.5% - 3.0% ] 2.68% | 4,056,994 | 5.1% |
[ 2.5% - 3.0% ] 2.89% | 2,590,624 | 5.7% |
[ 3.0% - 3.5% ] 3.12% | 2,727,225 | 5.2% |
[ 3.0% - 3.5% ] 3.34% | 2,115,831 | 5.2% |
[ 3.5% - 4.0% ] 3.56% | 1,904,451 | 5.1% |
[ 3.5% - 4.0% ] 3.78% | 1,673,183 | 5.2% |
[ 3.5% - 4.0% ] 3.99% | 1,274,503 | 5.1% |
[ 4.0% - 4.5% ] 4.19% | 1,055,553 | 4.9% |
[ 4.0% - 4.5% ] 4.39% | 3,049,036 | 6.0% |
[ 4.5% - 5.0% ] 4.62% | 890,286 | 5.2% |
[ 4.5% - 5.0% ] 4.85% | 925,311 | 4.8% |
[ 5.0% - 5.5% ] 5.05% | 638,519 | 6.2% |
[ 5.0% - 5.5% ] 5.26% | 890,843 | 5.4% |
[ 5.0% - 5.5% ] 5.50% | 872,372 | 5.9% |
[ 5.5% - 6.0% ] 5.68% | 540,729 | 5.0% |
[ 5.5% - 6.0% ] 5.89% | 425,327 | 5.2% |
[ 6.0% - 6.5% ] 6.10% | 702,143 | 5.0% |
[ 6.0% - 6.5% ] 6.32% | 491,082 | 5.2% |
[ 6.5% - 7.0% ] 6.55% | 586,838 | 4.7% |
[ 6.5% - 7.0% ] 6.77% | 443,282 | 4.5% |
[ 6.5% - 7.0% ] 6.89% | 4,229,716 | 4.4% |
[ 7.0% - 7.5% ] 7.18% | 398,920 | 5.0% |
[ 7.0% - 7.5% ] 7.40% | 201,067 | 4.2% |
[ 7.5% - 8.0% ] 7.62% | 379,162 | 5.9% |
[ 7.5% - 8.0% ] 7.83% | 442,057 | 4.4% |
[ 8.0% - 8.5% ] 8.07% | 523,773 | 4.7% |
[ 8.0% - 8.5% ] 8.32% | 111,922 | 5.2% |
[ 8.0% - 8.5% ] 8.45% | 474,433 | 7.1% |
[ 8.5% - 9.0% ] 8.76% | 275,533 | 5.1% |
[ 8.5% - 9.0% ] 8.84% | 85,102 | 8.4% |
[ 9.0% - 9.5% ] 9.11% | 460,232 | 3.9% |
[ 9.0% - 9.5% ] 9.35% | 326,192 | 5.1% |
[ 9.5% - 10.0% ] 9.54% | 164,727 | 4.7% |
[ 9.5% - 10.0% ] 9.86% | 29,451 | 9.8% |
[ 10.0% - 10.5% ] 10.03% | 245,000 | 5.2% |
[ 10.0% - 10.5% ] 10.20% | 97,332 | 6.2% |
[ 10.0% - 10.5% ] 10.46% | 96,356 | 3.9% |
[ 10.5% - 11.0% ] 10.57% | 171,371 | 4.2% |
[ 10.5% - 11.0% ] 10.83% | 148,515 | 4.6% |
[ 11.0% - 11.5% ] 11.06% | 252,751 | 7.4% |
[ 11.0% - 11.5% ] 11.26% | 104,223 | 6.0% |
[ 11.5% - 12.0% ] 11.51% | 64,921 | 2.4% |
[ 11.5% - 12.0% ] 11.69% | 167,741 | 6.1% |
[ 11.5% - 12.0% ] 11.91% | 208,563 | 5.4% |
[ 12.0% - 12.5% ] 12.13% | 89,488 | 4.7% |
[ 12.0% - 12.5% ] 12.37% | 236,936 | 4.6% |
[ 12.5% - 13.0% ] 12.51% | 54,358 | 5.7% |
[ 12.5% - 13.0% ] 12.81% | 65,316 | 3.2% |
[ 12.5% - 13.0% ] 13.00% | 152,703 | 5.6% |
[ 13.0% - 13.5% ] 13.19% | 107,743 | 5.2% |
[ 13.5% - 14.0% ] 13.66% | 130,830 | 4.2% |
[ 13.5% - 14.0% ] 13.84% | 24,963 | 7.0% |
[ 14.0% - 14.5% ] 14.11% | 114,309 | 7.4% |
[ 14.0% - 14.5% ] 14.33% | 134,582 | 5.8% |
[ 14.5% - 15.0% ] 14.51% | 139,247 | 5.8% |
[ 14.5% - 15.0% ] 14.77% | 150,447 | 7.9% |
[ 14.5% - 15.0% ] 14.99% | 146,584 | 3.3% |
[ 15.0% - 15.5% ] 15.12% | 860 | 10.6% |
[ 15.5% - 16.0% ] 15.56% | 75,388 | 1.8% |
[ 15.5% - 16.0% ] 15.77% | 50,114 | 3.4% |
[ 16.0% - 16.5% ] 16.09% | 56,628 | 2.9% |
[ 16.0% - 16.5% ] 16.23% | 142,992 | 5.7% |
[ 16.0% - 16.5% ] 16.43% | 45,208 | 4.3% |
[ 16.5% - 17.0% ] 16.76% | 57,182 | 2.9% |
[ 16.5% - 17.0% ] 16.78% | 6,453 | 3.0% |
[ 17.0% - 17.5% ] 17.09% | 32,271 | 4.8% |
[ 17.5% - 18.0% ] 17.71% | 67,229 | 3.1% |
[ 18.0% - 18.5% ] 18.11% | 55,960 | 2.6% |
[ 18.0% - 18.5% ] 18.39% | 63,751 | 3.0% |
[ 18.5% - 19.0% ] 18.62% | 18,346 | 4.5% |
[ 18.5% - 19.0% ] 18.75% | 63,975 | 3.1% |
[ 19.0% - 19.5% ] 19.12% | 17,123 | 3.5% |
[ 19.0% - 19.5% ] 19.27% | 38,524 | 4.8% |
[ 19.0% - 19.5% ] 19.48% | 5,605 | 5.6% |
[ 19.5% - 20.0% ] 19.68% | 81,379 | 3.7% |
[ 19.5% - 20.0% ] 19.87% | 97,824 | 7.1% |
[ 20.0% - 20.5% ] 20.03% | 56,319 | 2.4% |
[ 20.0% - 20.5% ] 20.25% | 33,927 | 4.4% |
[ 20.5% - 21.0% ] 20.60% | 61,783 | 3.2% |
[ 20.5% - 21.0% ] 20.82% | 51,837 | 7.0% |
[ 20.5% - 21.0% ] 20.98% | 53,308 | 3.8% |
[ 21.0% - 21.5% ] 21.48% | 58,557 | 3.2% |
[ 21.5% - 22.0% ] 21.56% | 19,289 | 2.1% |
[ 21.5% - 22.0% ] 21.74% | 28,660 | 6.6% |
[ 22.5% - 23.0% ] 22.52% | 14,470 | 4.5% |
[ 22.5% - 23.0% ] 22.65% | 34,625 | 3.1% |
[ 23.0% - 23.5% ] 23.12% | 19,102 | 6.4% |
[ 23.0% - 23.5% ] 23.38% | 53,349 | 3.9% |
[ 23.5% - 24.0% ] 23.60% | 19,704 | 5.8% |
[ 23.5% - 24.0% ] 23.74% | 19,233 | 6.3% |
[ 23.5% - 24.0% ] 23.95% | 27,886 | 1.2% |
[ 25.0% - 25.5% ] 25.00% | 164 | 6.8% |
[ 25.5% - 26.0% ] 25.55% | 21,778 | 1.9% |
[ 25.5% - 26.0% ] 25.64% | 35,336 | 5.0% |
[ 25.5% - 26.0% ] 25.88% | 167,043 | 5.6% |
[ 26.0% - 26.5% ] 26.12% | 82,627 | 6.9% |
[ 26.0% - 26.5% ] 26.22% | 39,875 | 9.5% |
[ 27.0% - 27.5% ] 27.19% | 22,276 | 3.6% |
[ 27.0% - 27.5% ] 27.47% | 22,966 | 2.4% |
[ 27.5% - 28.0% ] 27.55% | 766 | 1.9% |
[ 28.5% - 29.0% ] 28.88% | 7,515 | 11.2% |
[ 29.5% - 30.0% ] 29.79% | 10,563 | 4.6% |
[ 31.0% - 31.5% ] 31.00% | 101,422 | 1.8% |
[ 32.0% - 32.5% ] 32.26% | 1,516 | 3.8% |
[ 33.5% - 34.0% ] 33.91% | 14,162 | 4.4% |
[ 35.5% - 36.0% ] 35.98% | 1,751 | 6.2% |
[ 37.0% - 37.5% ] 37.43% | 12,603 | 4.5% |
[ 37.5% - 38.0% ] 37.91% | 2,118 | 8.0% |
[ 38.0% - 38.5% ] 38.45% | 684 | 3.7% |
[ 39.0% - 39.5% ] 39.40% | 1,764 | 5.4% |