Brazilian Disability Age 5 to 17
COMPARE
Brazilian
Select to Compare
Disability Age 5 to 17
Brazilian Disability Age 5 to 17
5.9%
DISABILITY | AGE 5 TO 17
0.9/ 100
METRIC RATING
258th/ 347
METRIC RANK
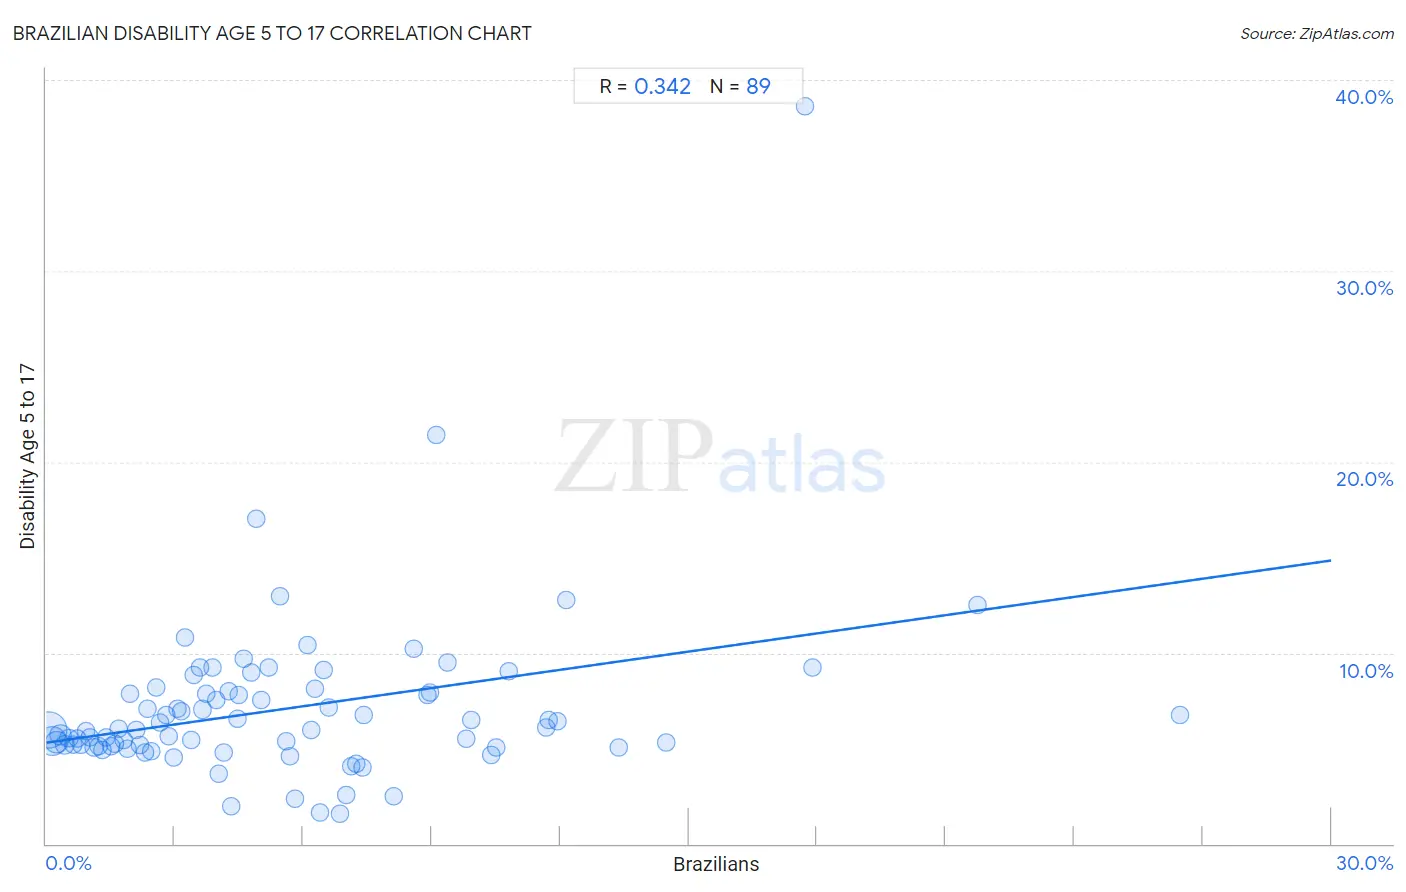
Brazilian Disability Age 5 to 17 Correlation Chart
The statistical analysis conducted on geographies consisting of 321,958,150 people shows a mild positive correlation between the proportion of Brazilians and percentage of population with a disability between the ages 5 and 17 in the United States with a correlation coefficient (R) of 0.342 and weighted average of 5.9%. On average, for every 1% (one percent) increase in Brazilians within a typical geography, there is an increase of 0.32% in percentage of population with a disability between the ages 5 and 17.
It is essential to understand that the correlation between the percentage of Brazilians and percentage of population with a disability between the ages 5 and 17 does not imply a direct cause-and-effect relationship. It remains uncertain whether the presence of Brazilians influences an upward or downward trend in the level of percentage of population with a disability between the ages 5 and 17 within an area, or if Brazilians simply ended up residing in those areas with higher or lower levels of percentage of population with a disability between the ages 5 and 17 due to other factors.
Demographics Similar to Brazilians by Disability Age 5 to 17
In terms of disability age 5 to 17, the demographic groups most similar to Brazilians are Hispanic or Latino (5.9%, a difference of 0.040%), Slavic (5.9%, a difference of 0.060%), Hopi (5.9%, a difference of 0.13%), Somali (5.9%, a difference of 0.19%), and Immigrants from Middle Africa (5.9%, a difference of 0.26%).
| Demographics | Rating | Rank | Disability Age 5 to 17 |
| Immigrants from Cambodia | 1.5 /100 | #251 | Tragic 5.9% |
| Hondurans | 1.5 /100 | #252 | Tragic 5.9% |
| Scandinavians | 1.4 /100 | #253 | Tragic 5.9% |
| Barbadians | 1.3 /100 | #254 | Tragic 5.9% |
| Italians | 1.2 /100 | #255 | Tragic 5.9% |
| Hopi | 1.0 /100 | #256 | Tragic 5.9% |
| Hispanics or Latinos | 1.0 /100 | #257 | Tragic 5.9% |
| Brazilians | 0.9 /100 | #258 | Tragic 5.9% |
| Slavs | 0.9 /100 | #259 | Tragic 5.9% |
| Somalis | 0.8 /100 | #260 | Tragic 5.9% |
| Immigrants from Middle Africa | 0.7 /100 | #261 | Tragic 5.9% |
| Immigrants from Western Africa | 0.7 /100 | #262 | Tragic 5.9% |
| Czechoslovakians | 0.7 /100 | #263 | Tragic 5.9% |
| Canadians | 0.6 /100 | #264 | Tragic 6.0% |
| Panamanians | 0.6 /100 | #265 | Tragic 6.0% |
Brazilian Disability Age 5 to 17 Correlation Summary
| Measurement | Brazilian Data | Disability Age 5 to 17 Data |
| Minimum | 0.046% | 1.6% |
| Maximum | 26.5% | 38.7% |
| Range | 26.4% | 37.1% |
| Mean | 5.6% | 7.1% |
| Median | 4.3% | 6.0% |
| Interquartile 25% (IQ1) | 2.1% | 5.1% |
| Interquartile 75% (IQ3) | 7.4% | 8.0% |
| Interquartile Range (IQR) | 5.3% | 2.8% |
| Standard Deviation (Sample) | 4.9% | 4.5% |
| Standard Deviation (Population) | 4.8% | 4.5% |
Correlation Details
| Brazilian Percentile | Sample Size | Disability Age 5 to 17 |
[ 0.0% - 0.5% ] 0.046% | 136,815,099 | 6.0% |
[ 0.0% - 0.5% ] 0.14% | 85,061,858 | 5.4% |
[ 0.0% - 0.5% ] 0.24% | 31,481,994 | 5.3% |
[ 0.0% - 0.5% ] 0.33% | 19,652,795 | 5.7% |
[ 0.0% - 0.5% ] 0.43% | 12,014,138 | 5.2% |
[ 0.5% - 1.0% ] 0.53% | 7,459,339 | 5.5% |
[ 0.5% - 1.0% ] 0.63% | 5,582,834 | 5.2% |
[ 0.5% - 1.0% ] 0.73% | 2,567,123 | 5.5% |
[ 0.5% - 1.0% ] 0.81% | 3,055,192 | 5.2% |
[ 0.5% - 1.0% ] 0.92% | 2,500,675 | 5.9% |
[ 1.0% - 1.5% ] 1.02% | 1,990,850 | 5.6% |
[ 1.0% - 1.5% ] 1.12% | 1,550,914 | 5.0% |
[ 1.0% - 1.5% ] 1.21% | 1,351,796 | 5.1% |
[ 1.0% - 1.5% ] 1.31% | 944,920 | 4.9% |
[ 1.0% - 1.5% ] 1.41% | 785,469 | 5.6% |
[ 1.5% - 2.0% ] 1.50% | 795,370 | 5.1% |
[ 1.5% - 2.0% ] 1.61% | 577,483 | 5.2% |
[ 1.5% - 2.0% ] 1.69% | 991,373 | 6.0% |
[ 1.5% - 2.0% ] 1.80% | 256,431 | 5.4% |
[ 1.5% - 2.0% ] 1.90% | 480,205 | 5.0% |
[ 1.5% - 2.0% ] 1.97% | 141,793 | 7.8% |
[ 2.0% - 2.5% ] 2.11% | 712,265 | 6.0% |
[ 2.0% - 2.5% ] 2.18% | 440,427 | 5.2% |
[ 2.0% - 2.5% ] 2.30% | 363,410 | 4.8% |
[ 2.0% - 2.5% ] 2.37% | 294,244 | 7.1% |
[ 2.0% - 2.5% ] 2.47% | 126,229 | 4.9% |
[ 2.5% - 3.0% ] 2.56% | 190,722 | 8.2% |
[ 2.5% - 3.0% ] 2.67% | 120,845 | 6.3% |
[ 2.5% - 3.0% ] 2.80% | 46,409 | 6.7% |
[ 2.5% - 3.0% ] 2.87% | 165,576 | 5.7% |
[ 2.5% - 3.0% ] 2.98% | 179,983 | 4.5% |
[ 3.0% - 3.5% ] 3.06% | 63,227 | 7.1% |
[ 3.0% - 3.5% ] 3.16% | 60,936 | 7.0% |
[ 3.0% - 3.5% ] 3.25% | 154 | 10.8% |
[ 3.0% - 3.5% ] 3.37% | 107,271 | 5.4% |
[ 3.0% - 3.5% ] 3.45% | 239,108 | 8.9% |
[ 3.5% - 4.0% ] 3.58% | 255,318 | 9.2% |
[ 3.5% - 4.0% ] 3.65% | 142,758 | 7.0% |
[ 3.5% - 4.0% ] 3.74% | 170,308 | 7.8% |
[ 3.5% - 4.0% ] 3.87% | 31,709 | 9.2% |
[ 3.5% - 4.0% ] 3.96% | 97,412 | 7.5% |
[ 4.0% - 4.5% ] 4.04% | 140,331 | 3.7% |
[ 4.0% - 4.5% ] 4.13% | 28,277 | 4.8% |
[ 4.0% - 4.5% ] 4.25% | 6,186 | 8.0% |
[ 4.0% - 4.5% ] 4.32% | 61,235 | 2.0% |
[ 4.0% - 4.5% ] 4.47% | 39,071 | 6.5% |
[ 4.0% - 4.5% ] 4.50% | 122,618 | 7.8% |
[ 4.5% - 5.0% ] 4.61% | 5,533 | 9.7% |
[ 4.5% - 5.0% ] 4.79% | 319,629 | 9.0% |
[ 4.5% - 5.0% ] 4.90% | 9,246 | 17.0% |
[ 5.0% - 5.5% ] 5.02% | 5,799 | 7.5% |
[ 5.0% - 5.5% ] 5.18% | 29,576 | 9.2% |
[ 5.0% - 5.5% ] 5.46% | 1,924 | 13.0% |
[ 5.5% - 6.0% ] 5.61% | 144,030 | 5.4% |
[ 5.5% - 6.0% ] 5.70% | 20,668 | 4.6% |
[ 5.5% - 6.0% ] 5.82% | 3,783 | 2.3% |
[ 6.0% - 6.5% ] 6.09% | 10,623 | 10.4% |
[ 6.0% - 6.5% ] 6.20% | 742 | 5.9% |
[ 6.0% - 6.5% ] 6.26% | 6,406 | 8.1% |
[ 6.0% - 6.5% ] 6.40% | 5,003 | 1.6% |
[ 6.0% - 6.5% ] 6.48% | 48,922 | 9.1% |
[ 6.5% - 7.0% ] 6.59% | 56,891 | 7.1% |
[ 6.5% - 7.0% ] 6.84% | 68,930 | 1.6% |
[ 6.5% - 7.0% ] 7.00% | 46,595 | 2.6% |
[ 7.0% - 7.5% ] 7.12% | 2,330 | 4.1% |
[ 7.0% - 7.5% ] 7.25% | 33,691 | 4.2% |
[ 7.0% - 7.5% ] 7.37% | 17,214 | 4.0% |
[ 7.0% - 7.5% ] 7.42% | 58,510 | 6.8% |
[ 8.0% - 8.5% ] 8.10% | 49,890 | 2.5% |
[ 8.5% - 9.0% ] 8.59% | 32,076 | 10.2% |
[ 8.5% - 9.0% ] 8.89% | 118,546 | 7.8% |
[ 8.5% - 9.0% ] 8.96% | 31,932 | 7.9% |
[ 9.0% - 9.5% ] 9.09% | 253 | 21.4% |
[ 9.0% - 9.5% ] 9.37% | 98,728 | 9.5% |
[ 9.5% - 10.0% ] 9.81% | 11,551 | 5.5% |
[ 9.5% - 10.0% ] 9.91% | 13,154 | 6.5% |
[ 10.0% - 10.5% ] 10.38% | 60,009 | 4.6% |
[ 10.5% - 11.0% ] 10.51% | 1,580 | 5.1% |
[ 10.5% - 11.0% ] 10.79% | 82,782 | 9.1% |
[ 11.5% - 12.0% ] 11.68% | 50,112 | 6.1% |
[ 11.5% - 12.0% ] 11.74% | 71,805 | 6.5% |
[ 11.5% - 12.0% ] 11.93% | 3,589 | 6.4% |
[ 12.0% - 12.5% ] 12.14% | 17,178 | 12.8% |
[ 13.0% - 13.5% ] 13.38% | 30,411 | 5.0% |
[ 14.0% - 14.5% ] 14.48% | 27,569 | 5.3% |
[ 17.5% - 18.0% ] 17.72% | 1,016 | 38.7% |
[ 17.5% - 18.0% ] 17.87% | 38,898 | 9.2% |
[ 21.5% - 22.0% ] 21.74% | 56,696 | 12.5% |
[ 26.0% - 26.5% ] 26.46% | 650 | 6.7% |