Paraguayan Disability Age 5 to 17
COMPARE
Paraguayan
Select to Compare
Disability Age 5 to 17
Paraguayan Disability Age 5 to 17
5.1%
DISABILITY | AGE 5 TO 17
99.9/ 100
METRIC RATING
54th/ 347
METRIC RANK
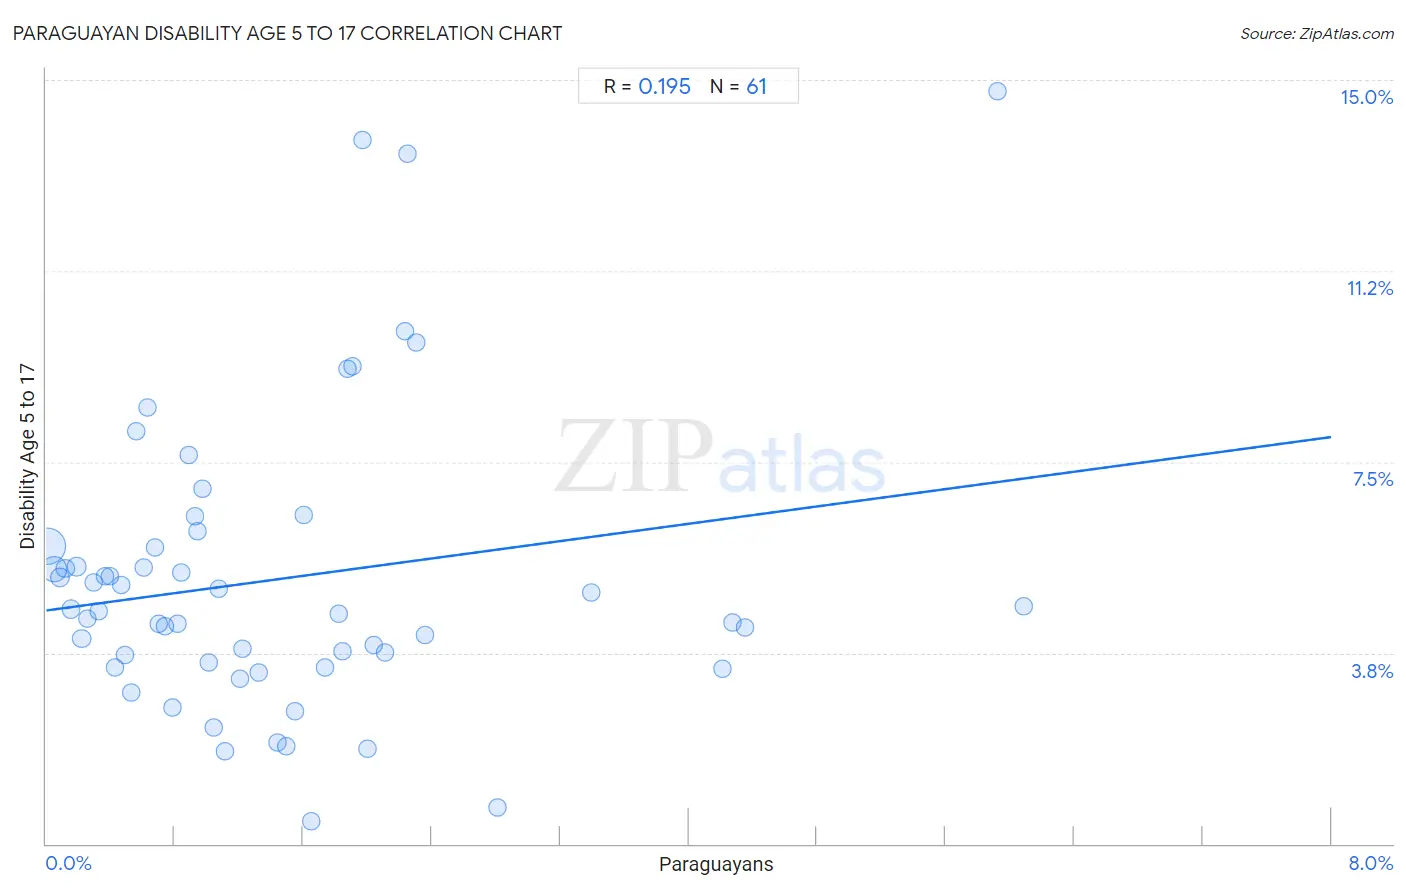
Paraguayan Disability Age 5 to 17 Correlation Chart
The statistical analysis conducted on geographies consisting of 94,920,755 people shows a poor positive correlation between the proportion of Paraguayans and percentage of population with a disability between the ages 5 and 17 in the United States with a correlation coefficient (R) of 0.195 and weighted average of 5.1%. On average, for every 1% (one percent) increase in Paraguayans within a typical geography, there is an increase of 0.43% in percentage of population with a disability between the ages 5 and 17.
It is essential to understand that the correlation between the percentage of Paraguayans and percentage of population with a disability between the ages 5 and 17 does not imply a direct cause-and-effect relationship. It remains uncertain whether the presence of Paraguayans influences an upward or downward trend in the level of percentage of population with a disability between the ages 5 and 17 within an area, or if Paraguayans simply ended up residing in those areas with higher or lower levels of percentage of population with a disability between the ages 5 and 17 due to other factors.
Demographics Similar to Paraguayans by Disability Age 5 to 17
In terms of disability age 5 to 17, the demographic groups most similar to Paraguayans are Immigrants from Lithuania (5.1%, a difference of 0.030%), Laotian (5.1%, a difference of 0.040%), Immigrants from Turkey (5.1%, a difference of 0.060%), Immigrants from Fiji (5.1%, a difference of 0.080%), and Turkish (5.1%, a difference of 0.17%).
| Demographics | Rating | Rank | Disability Age 5 to 17 |
| Vietnamese | 100.0 /100 | #47 | Exceptional 5.1% |
| Koreans | 100.0 /100 | #48 | Exceptional 5.1% |
| Immigrants from Western Asia | 100.0 /100 | #49 | Exceptional 5.1% |
| Argentineans | 99.9 /100 | #50 | Exceptional 5.1% |
| Turks | 99.9 /100 | #51 | Exceptional 5.1% |
| Immigrants from Fiji | 99.9 /100 | #52 | Exceptional 5.1% |
| Immigrants from Lithuania | 99.9 /100 | #53 | Exceptional 5.1% |
| Paraguayans | 99.9 /100 | #54 | Exceptional 5.1% |
| Laotians | 99.9 /100 | #55 | Exceptional 5.1% |
| Immigrants from Turkey | 99.9 /100 | #56 | Exceptional 5.1% |
| Immigrants from Poland | 99.9 /100 | #57 | Exceptional 5.1% |
| Immigrants from Ukraine | 99.9 /100 | #58 | Exceptional 5.1% |
| Immigrants from North Macedonia | 99.9 /100 | #59 | Exceptional 5.1% |
| Immigrants from Eastern Europe | 99.9 /100 | #60 | Exceptional 5.1% |
| Immigrants from Switzerland | 99.8 /100 | #61 | Exceptional 5.2% |
Paraguayan Disability Age 5 to 17 Correlation Summary
| Measurement | Paraguayan Data | Disability Age 5 to 17 Data |
| Minimum | 0.0097% | 0.43% |
| Maximum | 6.1% | 14.8% |
| Range | 6.1% | 14.4% |
| Mean | 1.4% | 5.2% |
| Median | 1.0% | 4.6% |
| Interquartile 25% (IQ1) | 0.51% | 3.5% |
| Interquartile 75% (IQ3) | 1.9% | 5.8% |
| Interquartile Range (IQR) | 1.4% | 2.3% |
| Standard Deviation (Sample) | 1.3% | 2.9% |
| Standard Deviation (Population) | 1.3% | 2.9% |
Correlation Details
| Paraguayan Percentile | Sample Size | Disability Age 5 to 17 |
[ 0.0% - 0.5% ] 0.0097% | 59,466,563 | 5.8% |
[ 0.0% - 0.5% ] 0.048% | 21,206,150 | 5.4% |
[ 0.0% - 0.5% ] 0.086% | 4,473,821 | 5.2% |
[ 0.0% - 0.5% ] 0.12% | 2,136,951 | 5.4% |
[ 0.0% - 0.5% ] 0.16% | 1,471,086 | 4.6% |
[ 0.0% - 0.5% ] 0.19% | 1,302,025 | 5.4% |
[ 0.0% - 0.5% ] 0.22% | 1,034,308 | 4.0% |
[ 0.0% - 0.5% ] 0.26% | 898,186 | 4.4% |
[ 0.0% - 0.5% ] 0.30% | 352,263 | 5.1% |
[ 0.0% - 0.5% ] 0.33% | 495,571 | 4.6% |
[ 0.0% - 0.5% ] 0.37% | 109,791 | 5.3% |
[ 0.0% - 0.5% ] 0.39% | 412,143 | 5.3% |
[ 0.0% - 0.5% ] 0.43% | 226,442 | 3.5% |
[ 0.0% - 0.5% ] 0.47% | 95,503 | 5.1% |
[ 0.0% - 0.5% ] 0.49% | 196,871 | 3.7% |
[ 0.5% - 1.0% ] 0.53% | 49,954 | 3.0% |
[ 0.5% - 1.0% ] 0.56% | 35,356 | 8.1% |
[ 0.5% - 1.0% ] 0.61% | 5,120 | 5.4% |
[ 0.5% - 1.0% ] 0.63% | 39,165 | 8.6% |
[ 0.5% - 1.0% ] 0.67% | 138,474 | 5.8% |
[ 0.5% - 1.0% ] 0.70% | 43,286 | 4.3% |
[ 0.5% - 1.0% ] 0.74% | 103,406 | 4.3% |
[ 0.5% - 1.0% ] 0.79% | 23,838 | 2.7% |
[ 0.5% - 1.0% ] 0.81% | 34,409 | 4.3% |
[ 0.5% - 1.0% ] 0.84% | 32,958 | 5.3% |
[ 0.5% - 1.0% ] 0.89% | 32,940 | 7.6% |
[ 0.5% - 1.0% ] 0.93% | 52,168 | 6.4% |
[ 0.5% - 1.0% ] 0.94% | 74,018 | 6.1% |
[ 0.5% - 1.0% ] 0.97% | 42,498 | 7.0% |
[ 1.0% - 1.5% ] 1.01% | 20,482 | 3.6% |
[ 1.0% - 1.5% ] 1.05% | 48,778 | 2.3% |
[ 1.0% - 1.5% ] 1.08% | 7,154 | 5.0% |
[ 1.0% - 1.5% ] 1.11% | 24,656 | 1.8% |
[ 1.0% - 1.5% ] 1.20% | 23,109 | 3.2% |
[ 1.0% - 1.5% ] 1.22% | 1,639 | 3.8% |
[ 1.0% - 1.5% ] 1.32% | 32,720 | 3.4% |
[ 1.0% - 1.5% ] 1.44% | 4,929 | 2.0% |
[ 1.0% - 1.5% ] 1.50% | 7,822 | 1.9% |
[ 1.5% - 2.0% ] 1.55% | 10,937 | 2.6% |
[ 1.5% - 2.0% ] 1.61% | 5,725 | 6.5% |
[ 1.5% - 2.0% ] 1.65% | 5,632 | 0.43% |
[ 1.5% - 2.0% ] 1.74% | 1,093 | 3.5% |
[ 1.5% - 2.0% ] 1.82% | 3,399 | 4.5% |
[ 1.5% - 2.0% ] 1.85% | 9,581 | 3.8% |
[ 1.5% - 2.0% ] 1.87% | 800 | 9.3% |
[ 1.5% - 2.0% ] 1.91% | 23,734 | 9.4% |
[ 1.5% - 2.0% ] 1.97% | 712 | 13.8% |
[ 2.0% - 2.5% ] 2.00% | 500 | 1.9% |
[ 2.0% - 2.5% ] 2.04% | 28,413 | 3.9% |
[ 2.0% - 2.5% ] 2.11% | 1,516 | 3.8% |
[ 2.0% - 2.5% ] 2.23% | 7,573 | 10.1% |
[ 2.0% - 2.5% ] 2.25% | 5,110 | 13.6% |
[ 2.0% - 2.5% ] 2.30% | 5,000 | 9.8% |
[ 2.0% - 2.5% ] 2.36% | 12,581 | 4.1% |
[ 2.5% - 3.0% ] 2.81% | 5,867 | 0.72% |
[ 3.0% - 3.5% ] 3.39% | 1,385 | 4.9% |
[ 4.0% - 4.5% ] 4.21% | 285 | 3.4% |
[ 4.0% - 4.5% ] 4.27% | 7,888 | 4.3% |
[ 4.0% - 4.5% ] 4.35% | 8,822 | 4.2% |
[ 5.5% - 6.0% ] 5.92% | 1,047 | 14.8% |
[ 6.0% - 6.5% ] 6.08% | 16,602 | 4.7% |