Guamanian/Chamorro Disability Age 5 to 17

COMPARE

Guamanian/Chamorro
Race
Ancestry
AfghanAfricanAlaska NativeAlaskan AthabascanAlbanianAleutAlsatianAmericanApacheArabArapahoArgentineanArmenianAssyrian/Chaldean/SyriacAustralianAustrianBahamianBangladeshiBarbadianBasqueBelgianBelizeanBermudanBhutaneseBlackfeetBolivianBrazilianBritishBritish West IndianBulgarianBurmeseCajunCambodianCanadianCape VerdeanCarpatho RusynCelticCentral AmericanCentral American IndianCherokeeCheyenneChickasawChileanChineseChippewaChoctawColombianColvilleComancheCosta RicanCreeCreekCroatianCrowCubanCypriotCzechCzechoslovakianDanishDelawareDominicanDutchDutch West IndianEastern EuropeanEcuadorianEgyptianEnglishEstonianEthiopianEuropeanFijianFilipinoFinnishFrenchFrench American IndianFrench CanadianGermanGerman RussianGhanaianGreekGuamanian/ChamorroGuatemalanGuyaneseHaitianHmongHonduranHopiHoumaHungarianIcelanderIndian (Asian)IndonesianInupiatIranianIraqiIrishIroquoisIsraeliItalianJamaicanJapaneseJordanianKenyanKiowaKoreanLaotianLatvianLebaneseLiberianLithuanianLumbeeLuxembourgerMacedonianMalaysianMalteseMarshalleseMenomineeMexicanMexican American IndianMongolianMoroccanNative HawaiianNavajoNepaleseNew ZealanderNicaraguanNigerianNorthern EuropeanNorwegianOkinawanOsageOttawaPaiutePakistaniPalestinianPanamanianParaguayanPennsylvania GermanPeruvianPimaPolishPortuguesePotawatomiPuebloPuerto RicanPuget Sound SalishRomanianRussianSalvadoranSamoanScandinavianScotch-IrishScottishSeminoleSenegaleseSerbianShoshoneSierra LeoneanSiouxSlavicSlovakSloveneSomaliSouth AfricanSouth AmericanSouth American IndianSoviet UnionSpaniardSpanishSpanish AmericanSpanish American IndianSri LankanSubsaharan AfricanSudaneseSwedishSwissSyrianTaiwaneseThaiTlingit-HaidaTohono O'OdhamTonganTrinidadian and TobagonianTsimshianTurkishU.S. Virgin IslanderUgandanUkrainianUruguayanUteVenezuelanVietnameseWelshWest IndianYakamaYaquiYugoslavianYumanYup'ikZimbabwean
Immigration
NonimmigrantsImmigrantsAfghanistanAfricaAlbaniaArgentinaArmeniaAsiaAustraliaAustriaBahamasBangladeshBarbadosBelarusBelgiumBelizeBoliviaBosnia and HerzegovinaBrazilBulgariaBurma/MyanmarCabo VerdeCambodiaCameroonCanadaCaribbeanCentral AmericaChileChinaColombiaCongoCosta RicaCroatiaCubaCzechoslovakiaDenmarkDominicaDominican RepublicEastern AfricaEastern AsiaEastern EuropeEcuadorEgyptEl SalvadorEnglandEritreaEthiopiaEuropeFijiFranceGermanyGhanaGreeceGrenadaGuatemalaGuyanaHaitiHondurasHong KongHungaryIndiaIndonesiaIranIraqIrelandIsraelItalyJamaicaJapanJordanKazakhstanKenyaKoreaKuwaitLaosLatin AmericaLatviaLebanonLiberiaLithuaniaMalaysiaMexicoMicronesiaMiddle AfricaMoldovaMoroccoNepalNetherlandsNicaraguaNigeriaNorth AmericaNorth MacedoniaNorthern AfricaNorthern EuropeNorwayOceaniaPakistanPanamaPeruPhilippinesPolandPortugalRomaniaRussiaSaudi ArabiaScotlandSenegalSerbiaSierra LeoneSingaporeSomaliaSouth AfricaSouth AmericaSouth Central AsiaSouth Eastern AsiaSouthern EuropeSpainSri LankaSt. Vincent and the GrenadinesSudanSwedenSwitzerlandSyriaTaiwanThailandTrinidad and TobagoTurkeyUgandaUkraineUruguayUzbekistanVenezuelaVietnamWest IndiesWestern AfricaWestern AsiaWestern EuropeYemenZaireZimbabweAzores
Select to Compare
Race
Ancestry
AfghanAfricanAlaska NativeAlaskan AthabascanAlbanianAleutAlsatianAmericanApacheArabArapahoArgentineanArmenianAssyrian/Chaldean/SyriacAustralianAustrianBahamianBangladeshiBarbadianBasqueBelgianBelizeanBermudanBhutaneseBlackfeetBolivianBrazilianBritishBritish West IndianBulgarianBurmeseCajunCambodianCanadianCape VerdeanCarpatho RusynCelticCentral AmericanCentral American IndianCherokeeCheyenneChickasawChileanChineseChippewaChoctawColombianColvilleComancheCosta RicanCreeCreekCroatianCrowCubanCypriotCzechCzechoslovakianDanishDelawareDominicanDutchDutch West IndianEastern EuropeanEcuadorianEgyptianEnglishEstonianEthiopianEuropeanFijianFilipinoFinnishFrenchFrench American IndianFrench CanadianGermanGerman RussianGhanaianGreekGuatemalanGuyaneseHaitianHmongHonduranHopiHoumaHungarianIcelanderIndian (Asian)IndonesianInupiatIranianIraqiIrishIroquoisIsraeliItalianJamaicanJapaneseJordanianKenyanKiowaKoreanLaotianLatvianLebaneseLiberianLithuanianLumbeeLuxembourgerMacedonianMalaysianMalteseMarshalleseMenomineeMexicanMexican American IndianMongolianMoroccanNative HawaiianNavajoNepaleseNew ZealanderNicaraguanNigerianNorthern EuropeanNorwegianOkinawanOsageOttawaPaiutePakistaniPalestinianPanamanianParaguayanPennsylvania GermanPeruvianPimaPolishPortuguesePotawatomiPuebloPuerto RicanPuget Sound SalishRomanianRussianSalvadoranSamoanScandinavianScotch-IrishScottishSeminoleSenegaleseSerbianShoshoneSierra LeoneanSiouxSlavicSlovakSloveneSomaliSouth AfricanSouth AmericanSouth American IndianSoviet UnionSpaniardSpanishSpanish AmericanSpanish American IndianSri LankanSubsaharan AfricanSudaneseSwedishSwissSyrianTaiwaneseThaiTlingit-HaidaTohono O'OdhamTonganTrinidadian and TobagonianTsimshianTurkishU.S. Virgin IslanderUgandanUkrainianUruguayanUteVenezuelanVietnameseWelshWest IndianYakamaYaquiYugoslavianYumanYup'ikZimbabwean
Immigration
NonimmigrantsImmigrantsAfghanistanAfricaAlbaniaArgentinaArmeniaAsiaAustraliaAustriaBahamasBangladeshBarbadosBelarusBelgiumBelizeBoliviaBosnia and HerzegovinaBrazilBulgariaBurma/MyanmarCabo VerdeCambodiaCameroonCanadaCaribbeanCentral AmericaChileChinaColombiaCongoCosta RicaCroatiaCubaCzechoslovakiaDenmarkDominicaDominican RepublicEastern AfricaEastern AsiaEastern EuropeEcuadorEgyptEl SalvadorEnglandEritreaEthiopiaEuropeFijiFranceGermanyGhanaGreeceGrenadaGuatemalaGuyanaHaitiHondurasHong KongHungaryIndiaIndonesiaIranIraqIrelandIsraelItalyJamaicaJapanJordanKazakhstanKenyaKoreaKuwaitLaosLatin AmericaLatviaLebanonLiberiaLithuaniaMalaysiaMexicoMicronesiaMiddle AfricaMoldovaMoroccoNepalNetherlandsNicaraguaNigeriaNorth AmericaNorth MacedoniaNorthern AfricaNorthern EuropeNorwayOceaniaPakistanPanamaPeruPhilippinesPolandPortugalRomaniaRussiaSaudi ArabiaScotlandSenegalSerbiaSierra LeoneSingaporeSomaliaSouth AfricaSouth AmericaSouth Central AsiaSouth Eastern AsiaSouthern EuropeSpainSri LankaSt. Vincent and the GrenadinesSudanSwedenSwitzerlandSyriaTaiwanThailandTrinidad and TobagoTurkeyUgandaUkraineUruguayUzbekistanVenezuelaVietnamWest IndiesWestern AfricaWestern AsiaWestern EuropeYemenZaireZimbabweAzores
Disability Age 5 to 17
Income
Poverty
Unemployment
Labor Participation
Family Structure
Vehicle Availability
Education Level
Disability

Guamanian/Chamorro Disability Age 5 to 17
Tragic

5.8%
DISABILITY | AGE 5 TO 17
5.6/ 100
METRIC RATING
225th/ 347
METRIC RANK

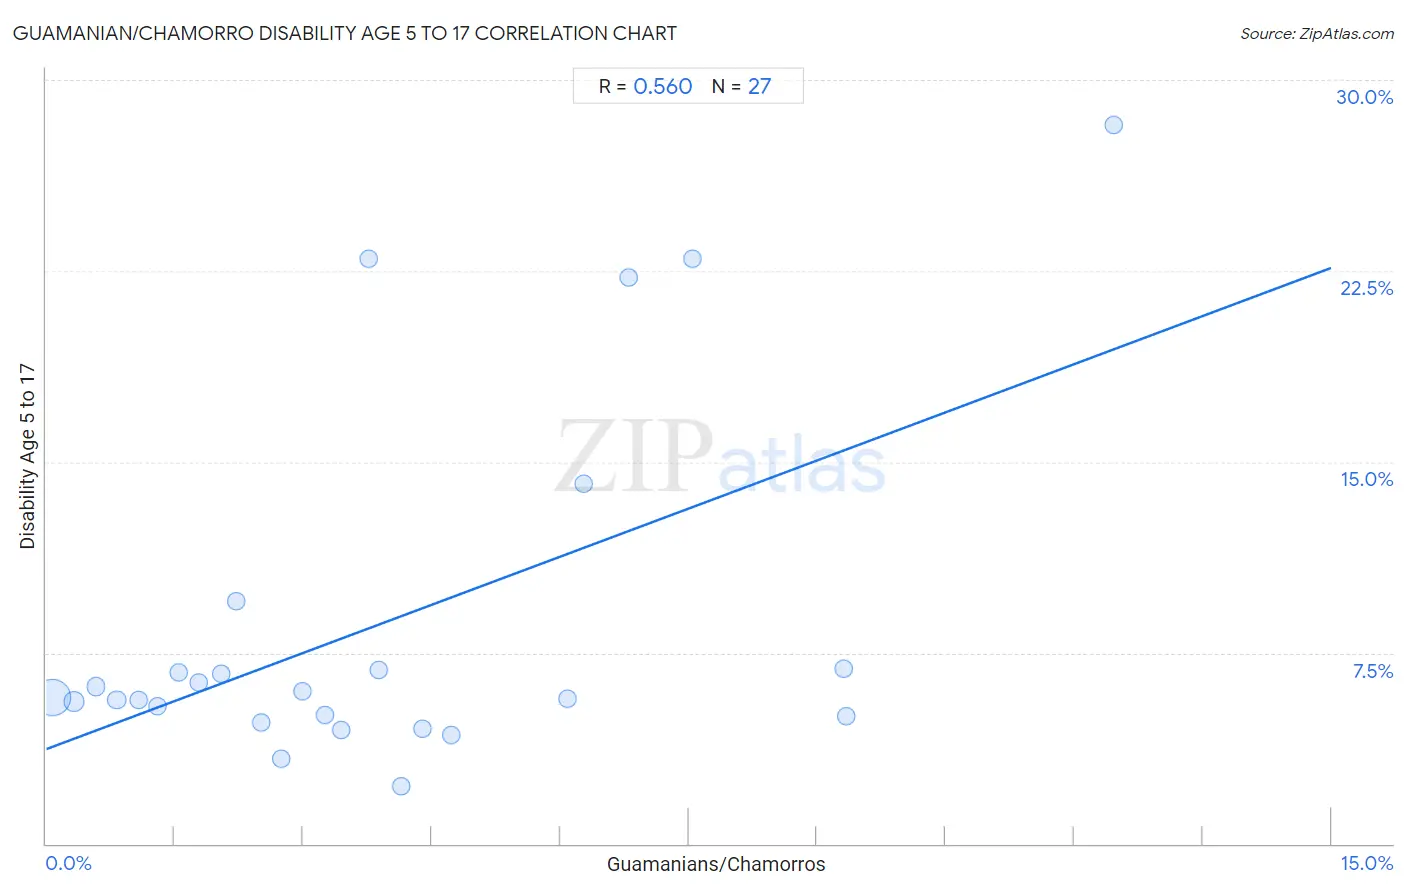
Guamanian/Chamorro Disability Age 5 to 17 Correlation Chart

The statistical analysis conducted on geographies consisting of 221,078,318 people shows a substantial positive correlation between the proportion of Guamanians/Chamorros and percentage of population with a disability between the ages 5 and 17 in the United States with a correlation coefficient (R) of 0.560 and weighted average of 5.8%. On average, for every 1% (one percent) increase in Guamanians/Chamorros within a typical geography, there is an increase of 1.3% in percentage of population with a disability between the ages 5 and 17.
Guamanian/Chamorro Disability Age 5 to 17
It is essential to understand that the correlation between the percentage of Guamanians/Chamorros and percentage of population with a disability between the ages 5 and 17 does not imply a direct cause-and-effect relationship. It remains uncertain whether the presence of Guamanians/Chamorros influences an upward or downward trend in the level of percentage of population with a disability between the ages 5 and 17 within an area, or if Guamanians/Chamorros simply ended up residing in those areas with higher or lower levels of percentage of population with a disability between the ages 5 and 17 due to other factors.

Demographics Similar to Guamanians/Chamorros by Disability Age 5 to 17

In terms of disability age 5 to 17, the demographic groups most similar to Guamanians/Chamorros are Mexican (5.8%, a difference of 0.020%), British West Indian (5.8%, a difference of 0.040%), Alsatian (5.8%, a difference of 0.080%), Swiss (5.8%, a difference of 0.12%), and Haitian (5.8%, a difference of 0.20%).
DemographicsRating | RankDisability Age 5 to 17
Immigrants from Sierra Leone
7.1
/100
|
#218
Tragic
5.8%
Sierra Leoneans
7.0
/100
|
#219
Tragic
5.8%
Belgians
6.9
/100
|
#220
Tragic
5.8%
Lithuanians
6.7
/100
|
#221
Tragic
5.8%
Immigrants from Sudan
6.7
/100
|
#222
Tragic
5.8%
Alsatians
6.0
/100
|
#223
Tragic
5.8%
Mexicans
5.7
/100
|
#224
Tragic
5.8%
Guamanians/Chamorros
5.6
/100
|
#225
Tragic
5.8%
British West Indians
5.4
/100
|
#226
Tragic
5.8%
Swiss
5.1
/100
|
#227
Tragic
5.8%
Haitians
4.8
/100
|
#228
Tragic
5.8%
Bangladeshis
4.8
/100
|
#229
Tragic
5.8%
Ghanaians
4.7
/100
|
#230
Tragic
5.8%
Europeans
4.5
/100
|
#231
Tragic
5.8%
Immigrants from Laos
3.8
/100
|
#232
Tragic
5.8%

Guamanian/Chamorro Disability Age 5 to 17 Correlation Summary

MeasurementGuamanian/Chamorro DataDisability Age 5 to 17 Data
Minimum0.066%2.3%
Maximum12.5%28.2%
Range12.4%26.0%
Mean3.9%8.6%
Median3.3%5.7%
Interquartile 25% (IQ1)1.5%5.0%
Interquartile 75% (IQ3)6.1%6.9%
Interquartile Range (IQR)4.5%1.9%
Standard Deviation (Sample)3.1%7.0%
Standard Deviation (Population)3.0%6.8%

Correlation Details

Guamanian/Chamorro PercentileSample SizeDisability Age 5 to 17
[
0.0%
-
0.5%
]
0.066%
190,402,5155.7%
[
0.0%
-
0.5%
]
0.33%
19,945,9125.6%
[
0.5%
-
1.0%
]
0.58%
5,514,0186.2%
[
0.5%
-
1.0%
]
0.82%
2,515,0405.6%
[
1.0%
-
1.5%
]
1.08%
1,244,4445.6%
[
1.0%
-
1.5%
]
1.30%
461,0715.4%
[
1.5%
-
2.0%
]
1.54%
400,4426.7%
[
1.5%
-
2.0%
]
1.78%
203,3506.4%
[
2.0%
-
2.5%
]
2.04%
134,8796.7%
[
2.0%
-
2.5%
]
2.22%
63,3529.5%
[
2.5%
-
3.0%
]
2.50%
40,3014.8%
[
2.5%
-
3.0%
]
2.74%
19,3123.3%
[
2.5%
-
3.0%
]
2.99%
17,2566.0%
[
3.0%
-
3.5%
]
3.26%
27,7075.1%
[
3.0%
-
3.5%
]
3.45%
41,4314.5%
[
3.5%
-
4.0%
]
3.76%
4,51923.0%
[
3.5%
-
4.0%
]
3.88%
1,9346.8%
[
4.0%
-
4.5%
]
4.14%
4,8042.3%
[
4.0%
-
4.5%
]
4.40%
4,2304.5%
[
4.5%
-
5.0%
]
4.73%
24,2864.3%
[
6.0%
-
6.5%
]
6.09%
2,6435.7%
[
6.0%
-
6.5%
]
6.27%
1,61114.1%
[
6.5%
-
7.0%
]
6.81%
52922.2%
[
7.5%
-
8.0%
]
7.55%
1,66923.0%
[
9.0%
-
9.5%
]
9.30%
1726.9%
[
9.0%
-
9.5%
]
9.34%
5785.0%
[
12.0%
-
12.5%
]
12.46%
31328.2%