Chilean Disability Age 5 to 17
COMPARE
Chilean
Select to Compare
Disability Age 5 to 17
Chilean Disability Age 5 to 17
5.4%
DISABILITY | AGE 5 TO 17
95.8/ 100
METRIC RATING
122nd/ 347
METRIC RANK
Chilean Disability Age 5 to 17 Correlation Chart
The statistical analysis conducted on geographies consisting of 255,519,515 people shows a poor positive correlation between the proportion of Chileans and percentage of population with a disability between the ages 5 and 17 in the United States with a correlation coefficient (R) of 0.112 and weighted average of 5.4%. On average, for every 1% (one percent) increase in Chileans within a typical geography, there is an increase of 0.20% in percentage of population with a disability between the ages 5 and 17.
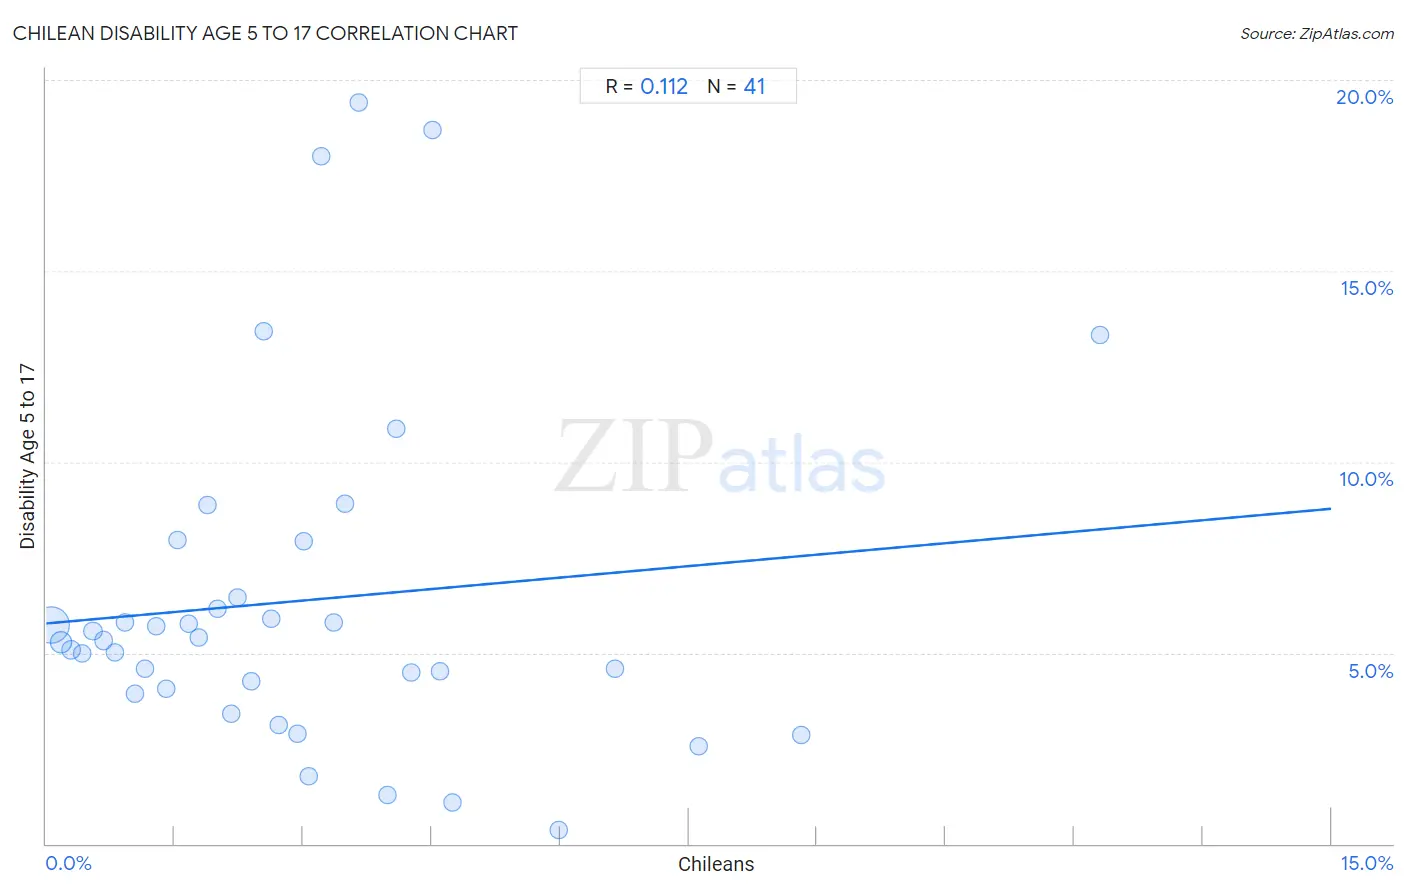
It is essential to understand that the correlation between the percentage of Chileans and percentage of population with a disability between the ages 5 and 17 does not imply a direct cause-and-effect relationship. It remains uncertain whether the presence of Chileans influences an upward or downward trend in the level of percentage of population with a disability between the ages 5 and 17 within an area, or if Chileans simply ended up residing in those areas with higher or lower levels of percentage of population with a disability between the ages 5 and 17 due to other factors.
Demographics Similar to Chileans by Disability Age 5 to 17
In terms of disability age 5 to 17, the demographic groups most similar to Chileans are Maltese (5.4%, a difference of 0.060%), Immigrants from Ethiopia (5.4%, a difference of 0.10%), Crow (5.4%, a difference of 0.23%), Immigrants from Chile (5.4%, a difference of 0.24%), and New Zealander (5.4%, a difference of 0.25%).
| Demographics | Rating | Rank | Disability Age 5 to 17 |
| Cubans | 97.8 /100 | #115 | Exceptional 5.3% |
| Cypriots | 97.7 /100 | #116 | Exceptional 5.3% |
| Immigrants from Afghanistan | 97.4 /100 | #117 | Exceptional 5.3% |
| South Americans | 97.1 /100 | #118 | Exceptional 5.4% |
| Immigrants from South America | 97.1 /100 | #119 | Exceptional 5.4% |
| Immigrants | 97.0 /100 | #120 | Exceptional 5.4% |
| Maltese | 96.0 /100 | #121 | Exceptional 5.4% |
| Chileans | 95.8 /100 | #122 | Exceptional 5.4% |
| Immigrants from Ethiopia | 95.5 /100 | #123 | Exceptional 5.4% |
| Crow | 95.0 /100 | #124 | Exceptional 5.4% |
| Immigrants from Chile | 95.0 /100 | #125 | Exceptional 5.4% |
| New Zealanders | 95.0 /100 | #126 | Exceptional 5.4% |
| Latvians | 95.0 /100 | #127 | Exceptional 5.4% |
| Immigrants from Venezuela | 94.5 /100 | #128 | Exceptional 5.4% |
| Romanians | 94.1 /100 | #129 | Exceptional 5.4% |
Chilean Disability Age 5 to 17 Correlation Summary
| Measurement | Chilean Data | Disability Age 5 to 17 Data |
| Minimum | 0.054% | 0.37% |
| Maximum | 12.3% | 19.4% |
| Range | 12.2% | 19.1% |
| Mean | 3.0% | 6.4% |
| Median | 2.5% | 5.3% |
| Interquartile 25% (IQ1) | 1.2% | 4.0% |
| Interquartile 75% (IQ3) | 4.0% | 7.2% |
| Interquartile Range (IQR) | 2.8% | 3.2% |
| Standard Deviation (Sample) | 2.5% | 4.5% |
| Standard Deviation (Population) | 2.5% | 4.4% |
Correlation Details
| Chilean Percentile | Sample Size | Disability Age 5 to 17 |
[ 0.0% - 0.5% ] 0.054% | 182,133,341 | 5.7% |
[ 0.0% - 0.5% ] 0.17% | 41,002,275 | 5.3% |
[ 0.0% - 0.5% ] 0.30% | 15,115,916 | 5.1% |
[ 0.0% - 0.5% ] 0.42% | 6,476,101 | 5.0% |
[ 0.5% - 1.0% ] 0.55% | 3,854,307 | 5.6% |
[ 0.5% - 1.0% ] 0.66% | 2,184,104 | 5.3% |
[ 0.5% - 1.0% ] 0.80% | 1,561,380 | 5.0% |
[ 0.5% - 1.0% ] 0.92% | 993,194 | 5.8% |
[ 1.0% - 1.5% ] 1.04% | 634,688 | 3.9% |
[ 1.0% - 1.5% ] 1.16% | 504,013 | 4.6% |
[ 1.0% - 1.5% ] 1.28% | 298,247 | 5.7% |
[ 1.0% - 1.5% ] 1.40% | 130,631 | 4.1% |
[ 1.5% - 2.0% ] 1.53% | 82,612 | 7.9% |
[ 1.5% - 2.0% ] 1.66% | 80,538 | 5.8% |
[ 1.5% - 2.0% ] 1.79% | 85,653 | 5.4% |
[ 1.5% - 2.0% ] 1.88% | 79,623 | 8.9% |
[ 2.0% - 2.5% ] 2.00% | 35,881 | 6.2% |
[ 2.0% - 2.5% ] 2.15% | 20,561 | 3.4% |
[ 2.0% - 2.5% ] 2.24% | 37,238 | 6.5% |
[ 2.0% - 2.5% ] 2.40% | 14,463 | 4.3% |
[ 2.5% - 3.0% ] 2.54% | 3,037 | 13.4% |
[ 2.5% - 3.0% ] 2.62% | 1,907 | 5.9% |
[ 2.5% - 3.0% ] 2.71% | 12,763 | 3.1% |
[ 2.5% - 3.0% ] 2.93% | 8,471 | 2.9% |
[ 3.0% - 3.5% ] 3.01% | 19,160 | 7.9% |
[ 3.0% - 3.5% ] 3.07% | 29,211 | 1.8% |
[ 3.0% - 3.5% ] 3.21% | 8,104 | 18.0% |
[ 3.0% - 3.5% ] 3.35% | 20,448 | 5.8% |
[ 3.0% - 3.5% ] 3.49% | 573 | 8.9% |
[ 3.5% - 4.0% ] 3.65% | 1,975 | 19.4% |
[ 3.5% - 4.0% ] 3.98% | 19,239 | 1.3% |
[ 4.0% - 4.5% ] 4.08% | 26,881 | 10.9% |
[ 4.0% - 4.5% ] 4.26% | 2,346 | 4.5% |
[ 4.5% - 5.0% ] 4.50% | 3,620 | 18.7% |
[ 4.5% - 5.0% ] 4.60% | 14,361 | 4.5% |
[ 4.5% - 5.0% ] 4.74% | 2,829 | 1.1% |
[ 5.5% - 6.0% ] 5.99% | 1,904 | 0.37% |
[ 6.5% - 7.0% ] 6.64% | 1,431 | 4.6% |
[ 7.5% - 8.0% ] 7.62% | 8,450 | 2.6% |
[ 8.5% - 9.0% ] 8.81% | 7,307 | 2.8% |
[ 12.0% - 12.5% ] 12.30% | 732 | 13.3% |