Immigrants from South Eastern Asia Disability Age 5 to 17
COMPARE
Immigrants from South Eastern Asia
Select to Compare
Disability Age 5 to 17
Immigrants from South Eastern Asia Disability Age 5 to 17
5.2%
DISABILITY | AGE 5 TO 17
99.8/ 100
METRIC RATING
64th/ 347
METRIC RANK
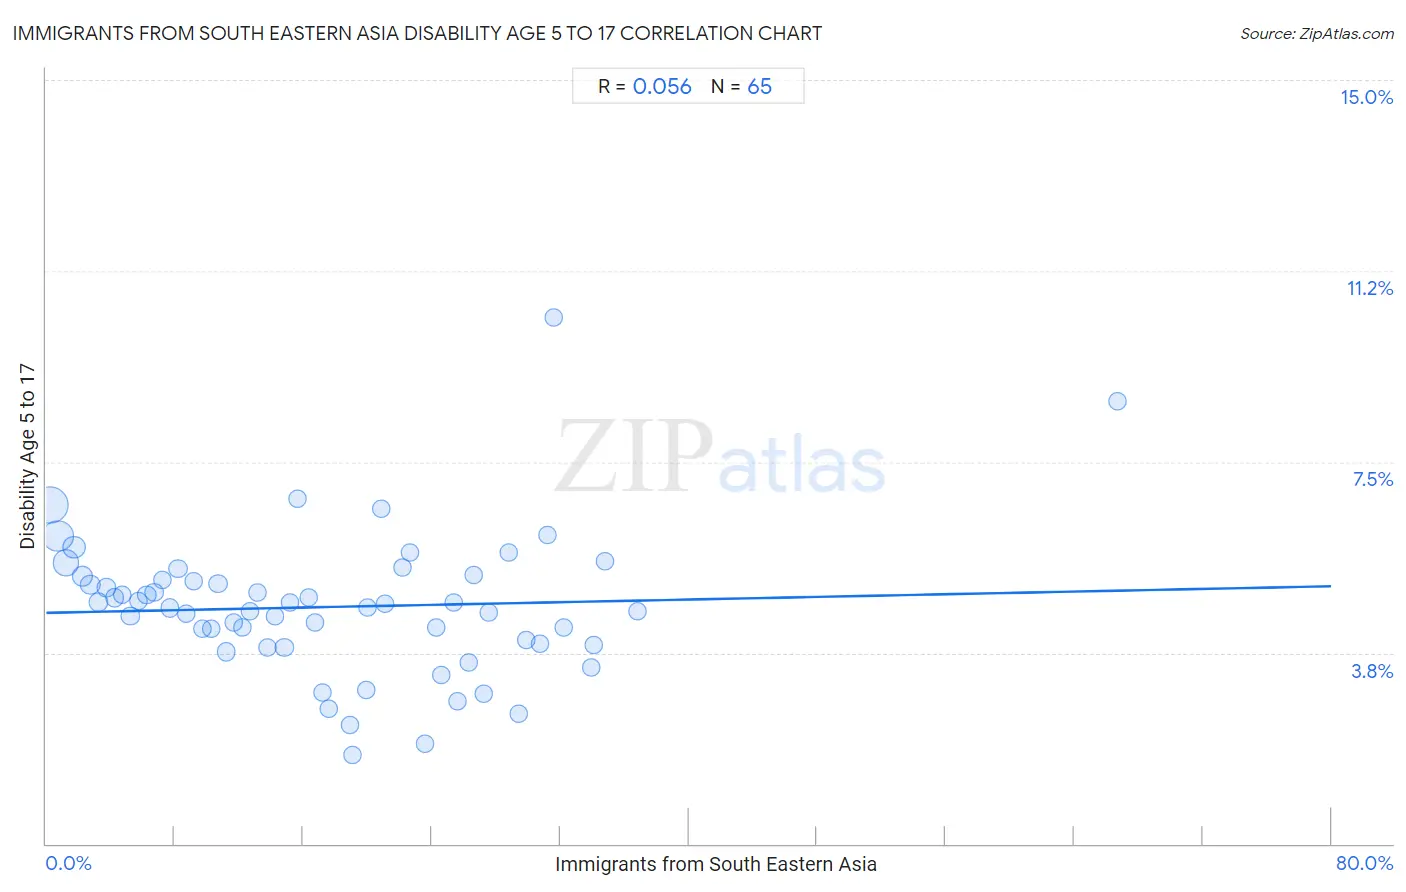
Immigrants from South Eastern Asia Disability Age 5 to 17 Correlation Chart
The statistical analysis conducted on geographies consisting of 505,803,855 people shows a slight positive correlation between the proportion of Immigrants from South Eastern Asia and percentage of population with a disability between the ages 5 and 17 in the United States with a correlation coefficient (R) of 0.056 and weighted average of 5.2%. On average, for every 1% (one percent) increase in Immigrants from South Eastern Asia within a typical geography, there is an increase of 0.0065% in percentage of population with a disability between the ages 5 and 17.
It is essential to understand that the correlation between the percentage of Immigrants from South Eastern Asia and percentage of population with a disability between the ages 5 and 17 does not imply a direct cause-and-effect relationship. It remains uncertain whether the presence of Immigrants from South Eastern Asia influences an upward or downward trend in the level of percentage of population with a disability between the ages 5 and 17 within an area, or if Immigrants from South Eastern Asia simply ended up residing in those areas with higher or lower levels of percentage of population with a disability between the ages 5 and 17 due to other factors.
Demographics Similar to Immigrants from South Eastern Asia by Disability Age 5 to 17
In terms of disability age 5 to 17, the demographic groups most similar to Immigrants from South Eastern Asia are Immigrants from Greece (5.2%, a difference of 0.010%), Immigrants from Bangladesh (5.2%, a difference of 0.030%), Palestinian (5.2%, a difference of 0.060%), Macedonian (5.2%, a difference of 0.080%), and Immigrants from Ireland (5.2%, a difference of 0.14%).
| Demographics | Rating | Rank | Disability Age 5 to 17 |
| Immigrants from Poland | 99.9 /100 | #57 | Exceptional 5.1% |
| Immigrants from Ukraine | 99.9 /100 | #58 | Exceptional 5.1% |
| Immigrants from North Macedonia | 99.9 /100 | #59 | Exceptional 5.1% |
| Immigrants from Eastern Europe | 99.9 /100 | #60 | Exceptional 5.1% |
| Immigrants from Switzerland | 99.8 /100 | #61 | Exceptional 5.2% |
| Immigrants from Ireland | 99.8 /100 | #62 | Exceptional 5.2% |
| Immigrants from Bangladesh | 99.8 /100 | #63 | Exceptional 5.2% |
| Immigrants from South Eastern Asia | 99.8 /100 | #64 | Exceptional 5.2% |
| Immigrants from Greece | 99.8 /100 | #65 | Exceptional 5.2% |
| Palestinians | 99.8 /100 | #66 | Exceptional 5.2% |
| Macedonians | 99.8 /100 | #67 | Exceptional 5.2% |
| Immigrants from Syria | 99.7 /100 | #68 | Exceptional 5.2% |
| Guyanese | 99.7 /100 | #69 | Exceptional 5.2% |
| Immigrants from Belgium | 99.7 /100 | #70 | Exceptional 5.2% |
| Jordanians | 99.7 /100 | #71 | Exceptional 5.2% |
Immigrants from South Eastern Asia Disability Age 5 to 17 Correlation Summary
| Measurement | Immigrants from South Eastern Asia Data | Disability Age 5 to 17 Data |
| Minimum | 0.25% | 1.7% |
| Maximum | 66.7% | 10.3% |
| Range | 66.4% | 8.6% |
| Mean | 17.5% | 4.6% |
| Median | 16.4% | 4.6% |
| Interquartile 25% (IQ1) | 8.0% | 3.9% |
| Interquartile 75% (IQ3) | 26.0% | 5.2% |
| Interquartile Range (IQR) | 18.0% | 1.3% |
| Standard Deviation (Sample) | 11.9% | 1.4% |
| Standard Deviation (Population) | 11.9% | 1.4% |
Correlation Details
| Immigrants from South Eastern Asia Percentile | Sample Size | Disability Age 5 to 17 |
[ 0.0% - 0.5% ] 0.25% | 168,837,219 | 6.6% |
[ 0.5% - 1.0% ] 0.73% | 116,977,259 | 6.0% |
[ 1.0% - 1.5% ] 1.23% | 73,227,207 | 5.5% |
[ 1.5% - 2.0% ] 1.73% | 38,638,045 | 5.8% |
[ 2.0% - 2.5% ] 2.22% | 23,323,059 | 5.3% |
[ 2.5% - 3.0% ] 2.75% | 16,926,239 | 5.1% |
[ 3.0% - 3.5% ] 3.24% | 16,916,266 | 4.7% |
[ 3.5% - 4.0% ] 3.74% | 8,309,494 | 5.0% |
[ 4.0% - 4.5% ] 4.25% | 6,795,641 | 4.8% |
[ 4.5% - 5.0% ] 4.73% | 5,084,363 | 4.9% |
[ 5.0% - 5.5% ] 5.23% | 4,048,401 | 4.5% |
[ 5.5% - 6.0% ] 5.75% | 4,598,741 | 4.8% |
[ 6.0% - 6.5% ] 6.26% | 1,931,224 | 4.9% |
[ 6.5% - 7.0% ] 6.72% | 3,100,585 | 4.9% |
[ 7.0% - 7.5% ] 7.25% | 1,578,461 | 5.2% |
[ 7.5% - 8.0% ] 7.70% | 2,416,924 | 4.6% |
[ 8.0% - 8.5% ] 8.20% | 1,542,382 | 5.4% |
[ 8.5% - 9.0% ] 8.74% | 728,355 | 4.5% |
[ 9.0% - 9.5% ] 9.21% | 1,034,084 | 5.1% |
[ 9.5% - 10.0% ] 9.72% | 1,323,530 | 4.2% |
[ 10.0% - 10.5% ] 10.30% | 481,737 | 4.2% |
[ 10.5% - 11.0% ] 10.70% | 1,129,096 | 5.1% |
[ 11.0% - 11.5% ] 11.20% | 669,194 | 3.8% |
[ 11.5% - 12.0% ] 11.68% | 464,349 | 4.4% |
[ 12.0% - 12.5% ] 12.21% | 1,335,960 | 4.3% |
[ 12.5% - 13.0% ] 12.70% | 386,678 | 4.6% |
[ 13.0% - 13.5% ] 13.13% | 161,294 | 4.9% |
[ 13.5% - 14.0% ] 13.74% | 419,626 | 3.9% |
[ 14.0% - 14.5% ] 14.23% | 52,529 | 4.5% |
[ 14.5% - 15.0% ] 14.82% | 364,165 | 3.8% |
[ 15.0% - 15.5% ] 15.19% | 296,699 | 4.7% |
[ 15.5% - 16.0% ] 15.67% | 68,191 | 6.8% |
[ 16.0% - 16.5% ] 16.36% | 379,434 | 4.8% |
[ 16.5% - 17.0% ] 16.75% | 343,687 | 4.3% |
[ 17.0% - 17.5% ] 17.20% | 72,607 | 3.0% |
[ 17.5% - 18.0% ] 17.57% | 39,967 | 2.6% |
[ 18.5% - 19.0% ] 18.92% | 100,898 | 2.3% |
[ 19.0% - 19.5% ] 19.06% | 81,180 | 1.7% |
[ 19.5% - 20.0% ] 19.91% | 13,765 | 3.0% |
[ 20.0% - 20.5% ] 20.03% | 734 | 4.6% |
[ 20.5% - 21.0% ] 20.83% | 115,162 | 6.6% |
[ 21.0% - 21.5% ] 21.10% | 84,817 | 4.7% |
[ 22.0% - 22.5% ] 22.20% | 136,693 | 5.4% |
[ 22.5% - 23.0% ] 22.64% | 102,104 | 5.7% |
[ 23.5% - 24.0% ] 23.62% | 110,453 | 2.0% |
[ 24.0% - 24.5% ] 24.26% | 160,487 | 4.2% |
[ 24.5% - 25.0% ] 24.61% | 65,125 | 3.3% |
[ 25.0% - 25.5% ] 25.36% | 212,618 | 4.7% |
[ 25.5% - 26.0% ] 25.62% | 25,902 | 2.8% |
[ 26.0% - 26.5% ] 26.34% | 52,755 | 3.6% |
[ 26.5% - 27.0% ] 26.65% | 72,605 | 5.3% |
[ 27.0% - 27.5% ] 27.24% | 16,457 | 3.0% |
[ 27.5% - 28.0% ] 27.55% | 47,630 | 4.5% |
[ 28.5% - 29.0% ] 28.78% | 403 | 5.7% |
[ 29.0% - 29.5% ] 29.40% | 40,738 | 2.6% |
[ 29.5% - 30.0% ] 29.87% | 16,072 | 4.0% |
[ 30.5% - 31.0% ] 30.72% | 47,549 | 3.9% |
[ 31.0% - 31.5% ] 31.24% | 36,657 | 6.1% |
[ 31.5% - 32.0% ] 31.63% | 98 | 10.3% |
[ 32.0% - 32.5% ] 32.23% | 181,268 | 4.2% |
[ 33.5% - 34.0% ] 33.96% | 9,160 | 3.5% |
[ 34.0% - 34.5% ] 34.06% | 22,622 | 3.9% |
[ 34.5% - 35.0% ] 34.76% | 39,873 | 5.5% |
[ 36.5% - 37.0% ] 36.78% | 4,342 | 4.6% |
[ 66.5% - 67.0% ] 66.69% | 2,996 | 8.7% |