Immigrants from Serbia Disability Age 5 to 17
COMPARE
Immigrants from Serbia
Select to Compare
Disability Age 5 to 17
Immigrants from Serbia Disability Age 5 to 17
4.9%
DISABILITY | AGE 5 TO 17
100.0/ 100
METRIC RATING
29th/ 347
METRIC RANK
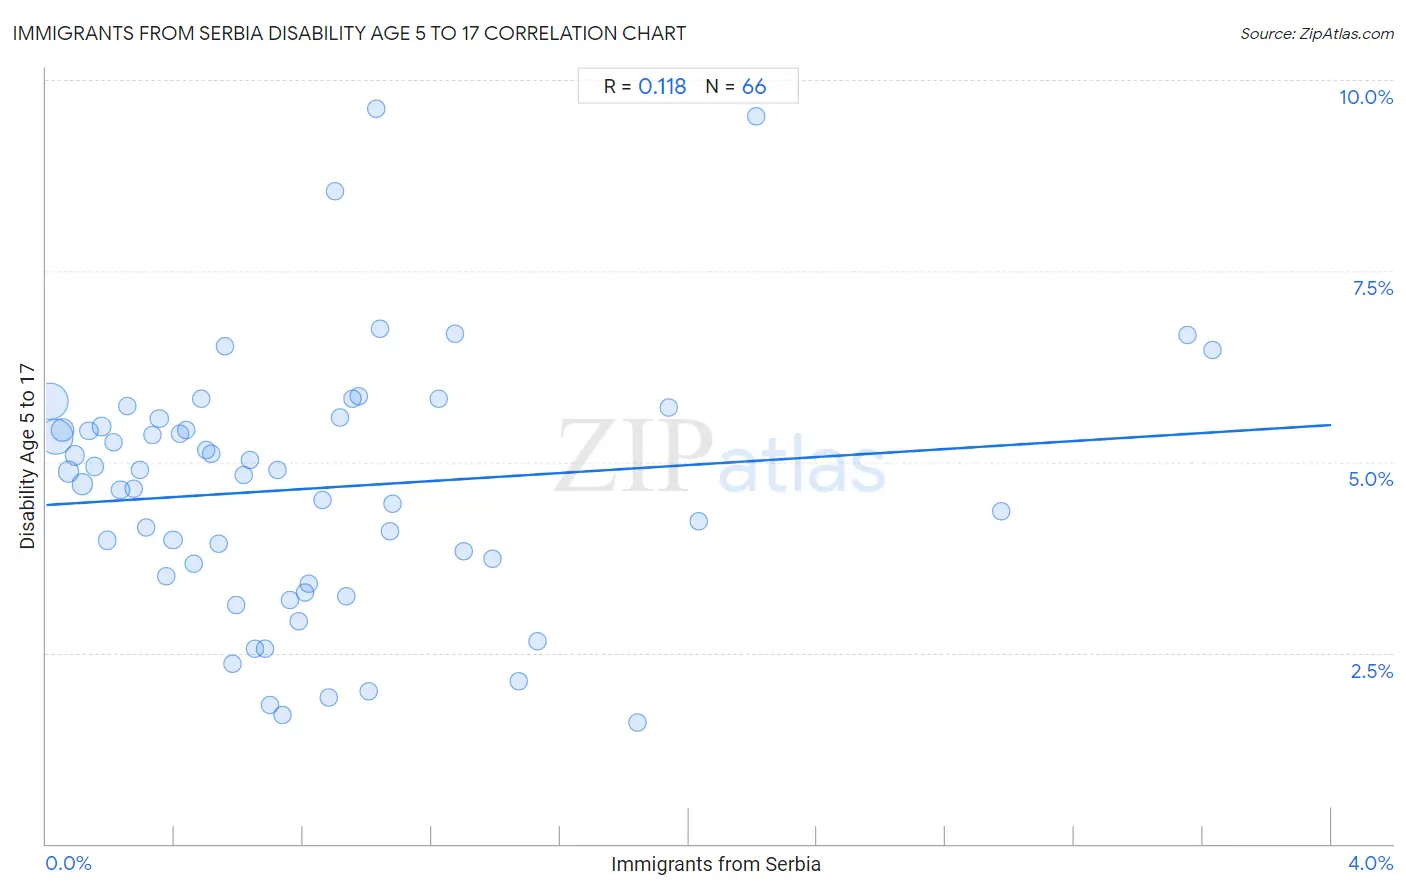
Immigrants from Serbia Disability Age 5 to 17 Correlation Chart
The statistical analysis conducted on geographies consisting of 131,235,247 people shows a poor positive correlation between the proportion of Immigrants from Serbia and percentage of population with a disability between the ages 5 and 17 in the United States with a correlation coefficient (R) of 0.118 and weighted average of 4.9%. On average, for every 1% (one percent) increase in Immigrants from Serbia within a typical geography, there is an increase of 0.26% in percentage of population with a disability between the ages 5 and 17.
It is essential to understand that the correlation between the percentage of Immigrants from Serbia and percentage of population with a disability between the ages 5 and 17 does not imply a direct cause-and-effect relationship. It remains uncertain whether the presence of Immigrants from Serbia influences an upward or downward trend in the level of percentage of population with a disability between the ages 5 and 17 within an area, or if Immigrants from Serbia simply ended up residing in those areas with higher or lower levels of percentage of population with a disability between the ages 5 and 17 due to other factors.
Demographics Similar to Immigrants from Serbia by Disability Age 5 to 17
In terms of disability age 5 to 17, the demographic groups most similar to Immigrants from Serbia are Immigrants from Malaysia (5.0%, a difference of 0.22%), Immigrants from Pakistan (5.0%, a difference of 0.47%), Immigrants from Japan (4.9%, a difference of 0.48%), Soviet Union (5.0%, a difference of 0.51%), and Taiwanese (4.9%, a difference of 0.56%).
| Demographics | Rating | Rank | Disability Age 5 to 17 |
| Asians | 100.0 /100 | #22 | Exceptional 4.8% |
| Immigrants from Bolivia | 100.0 /100 | #23 | Exceptional 4.8% |
| Immigrants from Lebanon | 100.0 /100 | #24 | Exceptional 4.8% |
| Immigrants from Asia | 100.0 /100 | #25 | Exceptional 4.8% |
| Bhutanese | 100.0 /100 | #26 | Exceptional 4.9% |
| Taiwanese | 100.0 /100 | #27 | Exceptional 4.9% |
| Immigrants from Japan | 100.0 /100 | #28 | Exceptional 4.9% |
| Immigrants from Serbia | 100.0 /100 | #29 | Exceptional 4.9% |
| Immigrants from Malaysia | 100.0 /100 | #30 | Exceptional 5.0% |
| Immigrants from Pakistan | 100.0 /100 | #31 | Exceptional 5.0% |
| Soviet Union | 100.0 /100 | #32 | Exceptional 5.0% |
| Immigrants from Indonesia | 100.0 /100 | #33 | Exceptional 5.0% |
| Israelis | 100.0 /100 | #34 | Exceptional 5.0% |
| Bolivians | 100.0 /100 | #35 | Exceptional 5.0% |
| Immigrants from Egypt | 100.0 /100 | #36 | Exceptional 5.0% |
Immigrants from Serbia Disability Age 5 to 17 Correlation Summary
| Measurement | Immigrants from Serbia Data | Disability Age 5 to 17 Data |
| Minimum | 0.0098% | 1.6% |
| Maximum | 3.6% | 9.6% |
| Range | 3.6% | 8.0% |
| Mean | 0.83% | 4.7% |
| Median | 0.67% | 4.9% |
| Interquartile 25% (IQ1) | 0.33% | 3.5% |
| Interquartile 75% (IQ3) | 1.0% | 5.6% |
| Interquartile Range (IQR) | 0.70% | 2.1% |
| Standard Deviation (Sample) | 0.75% | 1.7% |
| Standard Deviation (Population) | 0.75% | 1.7% |
Correlation Details
| Immigrants from Serbia Percentile | Sample Size | Disability Age 5 to 17 |
[ 0.0% - 0.5% ] 0.0098% | 46,376,572 | 5.8% |
[ 0.0% - 0.5% ] 0.030% | 41,092,592 | 5.3% |
[ 0.0% - 0.5% ] 0.049% | 12,209,858 | 5.4% |
[ 0.0% - 0.5% ] 0.070% | 7,120,880 | 4.9% |
[ 0.0% - 0.5% ] 0.090% | 3,865,782 | 5.1% |
[ 0.0% - 0.5% ] 0.11% | 7,139,477 | 4.7% |
[ 0.0% - 0.5% ] 0.13% | 2,102,057 | 5.4% |
[ 0.0% - 0.5% ] 0.15% | 1,884,676 | 4.9% |
[ 0.0% - 0.5% ] 0.17% | 1,367,406 | 5.5% |
[ 0.0% - 0.5% ] 0.19% | 1,263,301 | 4.0% |
[ 0.0% - 0.5% ] 0.21% | 986,295 | 5.3% |
[ 0.0% - 0.5% ] 0.23% | 639,622 | 4.6% |
[ 0.0% - 0.5% ] 0.25% | 830,128 | 5.7% |
[ 0.0% - 0.5% ] 0.27% | 241,911 | 4.7% |
[ 0.0% - 0.5% ] 0.29% | 433,352 | 4.9% |
[ 0.0% - 0.5% ] 0.31% | 220,779 | 4.1% |
[ 0.0% - 0.5% ] 0.33% | 203,719 | 5.4% |
[ 0.0% - 0.5% ] 0.35% | 595,664 | 5.6% |
[ 0.0% - 0.5% ] 0.37% | 155,292 | 3.5% |
[ 0.0% - 0.5% ] 0.39% | 363,594 | 4.0% |
[ 0.0% - 0.5% ] 0.42% | 153,932 | 5.4% |
[ 0.0% - 0.5% ] 0.44% | 76,639 | 5.4% |
[ 0.0% - 0.5% ] 0.46% | 134,767 | 3.7% |
[ 0.0% - 0.5% ] 0.48% | 176,132 | 5.8% |
[ 0.0% - 0.5% ] 0.50% | 87,839 | 5.2% |
[ 0.5% - 1.0% ] 0.51% | 66,504 | 5.1% |
[ 0.5% - 1.0% ] 0.54% | 222,532 | 3.9% |
[ 0.5% - 1.0% ] 0.56% | 11,864 | 6.5% |
[ 0.5% - 1.0% ] 0.58% | 24,340 | 2.4% |
[ 0.5% - 1.0% ] 0.59% | 95,708 | 3.1% |
[ 0.5% - 1.0% ] 0.62% | 57,982 | 4.8% |
[ 0.5% - 1.0% ] 0.63% | 129,237 | 5.0% |
[ 0.5% - 1.0% ] 0.65% | 18,743 | 2.6% |
[ 0.5% - 1.0% ] 0.68% | 53,609 | 2.6% |
[ 0.5% - 1.0% ] 0.70% | 73,589 | 1.8% |
[ 0.5% - 1.0% ] 0.72% | 90,959 | 4.9% |
[ 0.5% - 1.0% ] 0.74% | 10,313 | 1.7% |
[ 0.5% - 1.0% ] 0.76% | 72,685 | 3.2% |
[ 0.5% - 1.0% ] 0.79% | 110,012 | 2.9% |
[ 0.5% - 1.0% ] 0.80% | 15,291 | 3.3% |
[ 0.5% - 1.0% ] 0.82% | 100,341 | 3.4% |
[ 0.5% - 1.0% ] 0.86% | 59,624 | 4.5% |
[ 0.5% - 1.0% ] 0.88% | 6,378 | 1.9% |
[ 0.5% - 1.0% ] 0.90% | 22,686 | 8.5% |
[ 0.5% - 1.0% ] 0.92% | 15,404 | 5.6% |
[ 0.5% - 1.0% ] 0.93% | 2,890 | 3.2% |
[ 0.5% - 1.0% ] 0.95% | 21,434 | 5.8% |
[ 0.5% - 1.0% ] 0.97% | 20,940 | 5.9% |
[ 1.0% - 1.5% ] 1.00% | 299 | 2.0% |
[ 1.0% - 1.5% ] 1.03% | 6,432 | 9.6% |
[ 1.0% - 1.5% ] 1.04% | 6,444 | 6.7% |
[ 1.0% - 1.5% ] 1.07% | 15,861 | 4.1% |
[ 1.0% - 1.5% ] 1.08% | 42,529 | 4.4% |
[ 1.0% - 1.5% ] 1.22% | 5,651 | 5.8% |
[ 1.0% - 1.5% ] 1.27% | 9,977 | 6.7% |
[ 1.0% - 1.5% ] 1.30% | 5,775 | 3.8% |
[ 1.0% - 1.5% ] 1.39% | 31,647 | 3.7% |
[ 1.0% - 1.5% ] 1.47% | 13,070 | 2.1% |
[ 1.5% - 2.0% ] 1.53% | 35,112 | 2.7% |
[ 1.5% - 2.0% ] 1.84% | 2,280 | 1.6% |
[ 1.5% - 2.0% ] 1.94% | 21,357 | 5.7% |
[ 2.0% - 2.5% ] 2.03% | 936 | 4.2% |
[ 2.0% - 2.5% ] 2.21% | 317 | 9.5% |
[ 2.5% - 3.0% ] 2.97% | 6,322 | 4.3% |
[ 3.5% - 4.0% ] 3.55% | 1,885 | 6.7% |
[ 3.5% - 4.0% ] 3.63% | 4,022 | 6.5% |