Tlingit-Haida Married-couple Households

COMPARE

Tlingit-Haida
Race
Ancestry
AfghanAfricanAlaska NativeAlaskan AthabascanAlbanianAleutAlsatianAmericanApacheArabArapahoArgentineanArmenianAssyrian/Chaldean/SyriacAustralianAustrianBahamianBangladeshiBarbadianBasqueBelgianBelizeanBermudanBhutaneseBlackfeetBolivianBrazilianBritishBritish West IndianBulgarianBurmeseCajunCambodianCanadianCape VerdeanCarpatho RusynCelticCentral AmericanCentral American IndianCherokeeCheyenneChickasawChileanChineseChippewaChoctawColombianColvilleComancheCosta RicanCreeCreekCroatianCrowCubanCypriotCzechCzechoslovakianDanishDelawareDominicanDutchDutch West IndianEastern EuropeanEcuadorianEgyptianEnglishEstonianEthiopianEuropeanFijianFilipinoFinnishFrenchFrench American IndianFrench CanadianGermanGerman RussianGhanaianGreekGuamanian/ChamorroGuatemalanGuyaneseHaitianHmongHonduranHopiHoumaHungarianIcelanderIndian (Asian)IndonesianInupiatIranianIraqiIrishIroquoisIsraeliItalianJamaicanJapaneseJordanianKenyanKiowaKoreanLaotianLatvianLebaneseLiberianLithuanianLumbeeLuxembourgerMacedonianMalaysianMalteseMarshalleseMenomineeMexicanMexican American IndianMongolianMoroccanNative HawaiianNavajoNepaleseNew ZealanderNicaraguanNigerianNorthern EuropeanNorwegianOkinawanOsageOttawaPaiutePakistaniPalestinianPanamanianParaguayanPennsylvania GermanPeruvianPimaPolishPortuguesePotawatomiPuebloPuerto RicanPuget Sound SalishRomanianRussianSalvadoranSamoanScandinavianScotch-IrishScottishSeminoleSenegaleseSerbianShoshoneSierra LeoneanSiouxSlavicSlovakSloveneSomaliSouth AfricanSouth AmericanSouth American IndianSoviet UnionSpaniardSpanishSpanish AmericanSpanish American IndianSri LankanSubsaharan AfricanSudaneseSwedishSwissSyrianTaiwaneseThaiTlingit-HaidaTohono O'OdhamTonganTrinidadian and TobagonianTsimshianTurkishU.S. Virgin IslanderUgandanUkrainianUruguayanUteVenezuelanVietnameseWelshWest IndianYakamaYaquiYugoslavianYumanYup'ikZimbabwean
Immigration
NonimmigrantsImmigrantsAfghanistanAfricaAlbaniaArgentinaArmeniaAsiaAustraliaAustriaBahamasBangladeshBarbadosBelarusBelgiumBelizeBoliviaBosnia and HerzegovinaBrazilBulgariaBurma/MyanmarCabo VerdeCambodiaCameroonCanadaCaribbeanCentral AmericaChileChinaColombiaCongoCosta RicaCroatiaCubaCzechoslovakiaDenmarkDominicaDominican RepublicEastern AfricaEastern AsiaEastern EuropeEcuadorEgyptEl SalvadorEnglandEritreaEthiopiaEuropeFijiFranceGermanyGhanaGreeceGrenadaGuatemalaGuyanaHaitiHondurasHong KongHungaryIndiaIndonesiaIranIraqIrelandIsraelItalyJamaicaJapanJordanKazakhstanKenyaKoreaKuwaitLaosLatin AmericaLatviaLebanonLiberiaLithuaniaMalaysiaMexicoMicronesiaMiddle AfricaMoldovaMoroccoNepalNetherlandsNicaraguaNigeriaNorth AmericaNorth MacedoniaNorthern AfricaNorthern EuropeNorwayOceaniaPakistanPanamaPeruPhilippinesPolandPortugalRomaniaRussiaSaudi ArabiaScotlandSenegalSerbiaSierra LeoneSingaporeSomaliaSouth AfricaSouth AmericaSouth Central AsiaSouth Eastern AsiaSouthern EuropeSpainSri LankaSt. Vincent and the GrenadinesSudanSwedenSwitzerlandSyriaTaiwanThailandTrinidad and TobagoTurkeyUgandaUkraineUruguayUzbekistanVenezuelaVietnamWest IndiesWestern AfricaWestern AsiaWestern EuropeYemenZaireZimbabweAzores
Select to Compare
Race
Ancestry
AfghanAfricanAlaska NativeAlaskan AthabascanAlbanianAleutAlsatianAmericanApacheArabArapahoArgentineanArmenianAssyrian/Chaldean/SyriacAustralianAustrianBahamianBangladeshiBarbadianBasqueBelgianBelizeanBermudanBhutaneseBlackfeetBolivianBrazilianBritishBritish West IndianBulgarianBurmeseCajunCambodianCanadianCape VerdeanCarpatho RusynCelticCentral AmericanCentral American IndianCherokeeCheyenneChickasawChileanChineseChippewaChoctawColombianColvilleComancheCosta RicanCreeCreekCroatianCrowCubanCypriotCzechCzechoslovakianDanishDelawareDominicanDutchDutch West IndianEastern EuropeanEcuadorianEgyptianEnglishEstonianEthiopianEuropeanFijianFilipinoFinnishFrenchFrench American IndianFrench CanadianGermanGerman RussianGhanaianGreekGuamanian/ChamorroGuatemalanGuyaneseHaitianHmongHonduranHopiHoumaHungarianIcelanderIndian (Asian)IndonesianInupiatIranianIraqiIrishIroquoisIsraeliItalianJamaicanJapaneseJordanianKenyanKiowaKoreanLaotianLatvianLebaneseLiberianLithuanianLumbeeLuxembourgerMacedonianMalaysianMalteseMarshalleseMenomineeMexicanMexican American IndianMongolianMoroccanNative HawaiianNavajoNepaleseNew ZealanderNicaraguanNigerianNorthern EuropeanNorwegianOkinawanOsageOttawaPaiutePakistaniPalestinianPanamanianParaguayanPennsylvania GermanPeruvianPimaPolishPortuguesePotawatomiPuebloPuerto RicanPuget Sound SalishRomanianRussianSalvadoranSamoanScandinavianScotch-IrishScottishSeminoleSenegaleseSerbianShoshoneSierra LeoneanSiouxSlavicSlovakSloveneSomaliSouth AfricanSouth AmericanSouth American IndianSoviet UnionSpaniardSpanishSpanish AmericanSpanish American IndianSri LankanSubsaharan AfricanSudaneseSwedishSwissSyrianTaiwaneseThaiTohono O'OdhamTonganTrinidadian and TobagonianTsimshianTurkishU.S. Virgin IslanderUgandanUkrainianUruguayanUteVenezuelanVietnameseWelshWest IndianYakamaYaquiYugoslavianYumanYup'ikZimbabwean
Immigration
NonimmigrantsImmigrantsAfghanistanAfricaAlbaniaArgentinaArmeniaAsiaAustraliaAustriaBahamasBangladeshBarbadosBelarusBelgiumBelizeBoliviaBosnia and HerzegovinaBrazilBulgariaBurma/MyanmarCabo VerdeCambodiaCameroonCanadaCaribbeanCentral AmericaChileChinaColombiaCongoCosta RicaCroatiaCubaCzechoslovakiaDenmarkDominicaDominican RepublicEastern AfricaEastern AsiaEastern EuropeEcuadorEgyptEl SalvadorEnglandEritreaEthiopiaEuropeFijiFranceGermanyGhanaGreeceGrenadaGuatemalaGuyanaHaitiHondurasHong KongHungaryIndiaIndonesiaIranIraqIrelandIsraelItalyJamaicaJapanJordanKazakhstanKenyaKoreaKuwaitLaosLatin AmericaLatviaLebanonLiberiaLithuaniaMalaysiaMexicoMicronesiaMiddle AfricaMoldovaMoroccoNepalNetherlandsNicaraguaNigeriaNorth AmericaNorth MacedoniaNorthern AfricaNorthern EuropeNorwayOceaniaPakistanPanamaPeruPhilippinesPolandPortugalRomaniaRussiaSaudi ArabiaScotlandSenegalSerbiaSierra LeoneSingaporeSomaliaSouth AfricaSouth AmericaSouth Central AsiaSouth Eastern AsiaSouthern EuropeSpainSri LankaSt. Vincent and the GrenadinesSudanSwedenSwitzerlandSyriaTaiwanThailandTrinidad and TobagoTurkeyUgandaUkraineUruguayUzbekistanVenezuelaVietnamWest IndiesWestern AfricaWestern AsiaWestern EuropeYemenZaireZimbabweAzores
Married-couple Households
Income
Poverty
Unemployment
Labor Participation
Family Structure
Vehicle Availability
Education Level
Disability

Tlingit-Haida Married-couple Households
Tragic

45.1%
MARRIED-COUPLE HOUSEHOLDS
4.9/ 100
METRIC RATING
221st/ 347
METRIC RANK

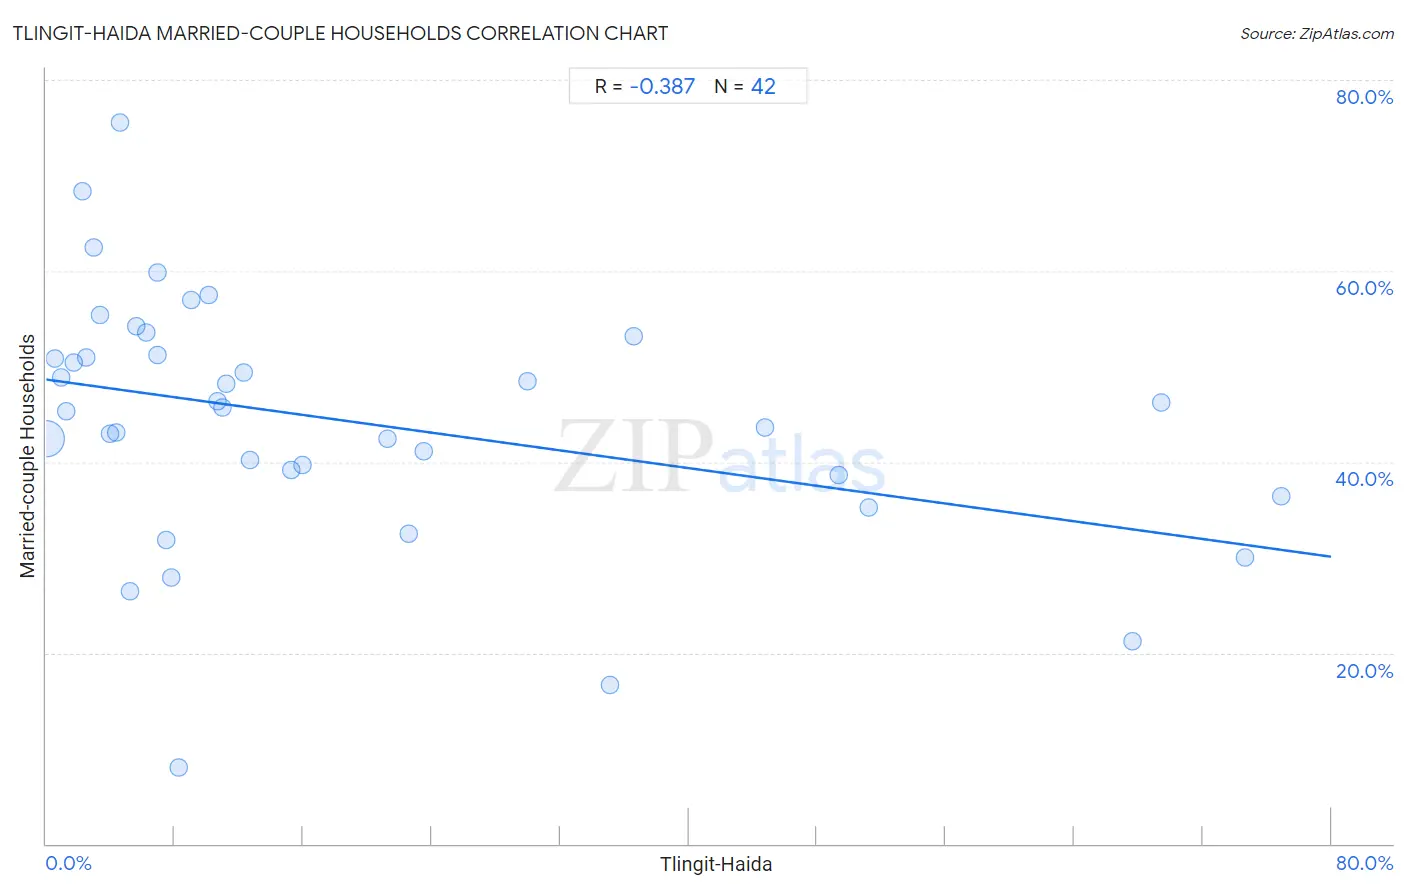
Tlingit-Haida Married-couple Households Correlation Chart

The statistical analysis conducted on geographies consisting of 60,855,605 people shows a mild negative correlation between the proportion of Tlingit-Haida and percentage of married-couple family households in the United States with a correlation coefficient (R) of -0.387 and weighted average of 45.1%. On average, for every 1% (one percent) increase in Tlingit-Haida within a typical geography, there is a decrease of 0.23% in percentage of married-couple family households.
Tlingit-Haida Married-couple Households
It is essential to understand that the correlation between the percentage of Tlingit-Haida and percentage of married-couple family households does not imply a direct cause-and-effect relationship. It remains uncertain whether the presence of Tlingit-Haida influences an upward or downward trend in the level of percentage of married-couple family households within an area, or if Tlingit-Haida simply ended up residing in those areas with higher or lower levels of percentage of married-couple family households due to other factors.

Demographics Similar to Tlingit-Haida by Married-couple Households

In terms of married-couple households, the demographic groups most similar to Tlingit-Haida are Immigrants from Thailand (45.2%, a difference of 0.050%), Immigrants from Laos (45.1%, a difference of 0.050%), Nicaraguan (45.2%, a difference of 0.080%), Immigrants from the Azores (45.2%, a difference of 0.090%), and Panamanian (45.2%, a difference of 0.11%).
DemographicsRating | RankMarried-couple Households
Japanese
5.7
/100
|
#214
Tragic
45.2%
Immigrants from Nepal
5.6
/100
|
#215
Tragic
45.2%
Immigrants from Portugal
5.6
/100
|
#216
Tragic
45.2%
Panamanians
5.5
/100
|
#217
Tragic
45.2%
Immigrants from the Azores
5.3
/100
|
#218
Tragic
45.2%
Nicaraguans
5.3
/100
|
#219
Tragic
45.2%
Immigrants from Thailand
5.1
/100
|
#220
Tragic
45.2%
Tlingit-Haida
4.9
/100
|
#221
Tragic
45.1%
Immigrants from Laos
4.6
/100
|
#222
Tragic
45.1%
Immigrants from Cambodia
2.7
/100
|
#223
Tragic
44.9%
Immigrants from Micronesia
2.6
/100
|
#224
Tragic
44.9%
Dutch West Indians
2.6
/100
|
#225
Tragic
44.9%
Alsatians
2.3
/100
|
#226
Tragic
44.8%
Salvadorans
1.9
/100
|
#227
Tragic
44.7%
Kenyans
1.7
/100
|
#228
Tragic
44.7%

Tlingit-Haida Married-couple Households Correlation Summary

MeasurementTlingit-Haida DataMarried-couple Households Data
Minimum0.036%8.0%
Maximum76.8%75.5%
Range76.8%67.5%
Mean18.9%44.2%
Median9.6%45.5%
Interquartile 25% (IQ1)4.3%38.7%
Interquartile 75% (IQ3)23.5%51.2%
Interquartile Range (IQR)19.2%12.6%
Standard Deviation (Sample)21.9%13.1%
Standard Deviation (Population)21.7%13.0%

Correlation Details

Tlingit-Haida PercentileSample SizeMarried-couple Households
[
0.0%
-
0.5%
]
0.036%
59,016,73542.4%
[
0.5%
-
1.0%
]
0.54%
1,312,33950.8%
[
0.5%
-
1.0%
]
0.91%
247,81848.9%
[
1.0%
-
1.5%
]
1.24%
85,68745.3%
[
1.5%
-
2.0%
]
1.71%
25,68550.5%
[
2.0%
-
2.5%
]
2.28%
8,44768.3%
[
2.0%
-
2.5%
]
2.46%
3,65551.0%
[
2.5%
-
3.0%
]
2.92%
6,23162.5%
[
3.0%
-
3.5%
]
3.33%
10,38855.4%
[
3.5%
-
4.0%
]
3.97%
1,96443.0%
[
4.0%
-
4.5%
]
4.35%
11543.0%
[
4.5%
-
5.0%
]
4.62%
82275.5%
[
5.0%
-
5.5%
]
5.24%
42026.4%
[
5.5%
-
6.0%
]
5.62%
1,76254.1%
[
6.0%
-
6.5%
]
6.21%
17753.6%
[
6.5%
-
7.0%
]
6.91%
56459.8%
[
6.5%
-
7.0%
]
6.94%
2,14651.2%
[
7.0%
-
7.5%
]
7.50%
4031.8%
[
7.5%
-
8.0%
]
7.80%
1,25727.9%
[
8.0%
-
8.5%
]
8.22%
1468.0%
[
8.5%
-
9.0%
]
9.00%
6,69157.0%
[
10.0%
-
10.5%
]
10.13%
2,90257.5%
[
10.5%
-
11.0%
]
10.70%
29,93346.3%
[
11.0%
-
11.5%
]
11.00%
32,10845.7%
[
11.0%
-
11.5%
]
11.18%
13,91348.2%
[
12.0%
-
12.5%
]
12.26%
18,04149.3%
[
12.5%
-
13.0%
]
12.66%
8,64740.2%
[
15.0%
-
15.5%
]
15.26%
2,16939.2%
[
15.5%
-
16.0%
]
15.92%
1,72739.7%
[
21.0%
-
21.5%
]
21.23%
4,26742.5%
[
22.5%
-
23.0%
]
22.55%
1,07332.5%
[
23.5%
-
24.0%
]
23.53%
8541.2%
[
29.5%
-
30.0%
]
29.96%
1,12848.5%
[
35.0%
-
35.5%
]
35.09%
5716.7%
[
36.5%
-
37.0%
]
36.59%
8253.1%
[
44.5%
-
45.0%
]
44.78%
92043.6%
[
49.0%
-
49.5%
]
49.33%
1,79238.7%
[
51.0%
-
51.5%
]
51.24%
80435.3%
[
67.5%
-
68.0%
]
67.59%
36121.2%
[
69.0%
-
69.5%
]
69.41%
1,60246.2%
[
74.5%
-
75.0%
]
74.63%
6730.0%
[
76.5%
-
77.0%
]
76.85%
83836.4%