Immigrants from Panama Disability Age 5 to 17
COMPARE
Immigrants from Panama
Select to Compare
Disability Age 5 to 17
Immigrants from Panama Disability Age 5 to 17
5.8%
DISABILITY | AGE 5 TO 17
8.7/ 100
METRIC RATING
212th/ 347
METRIC RANK
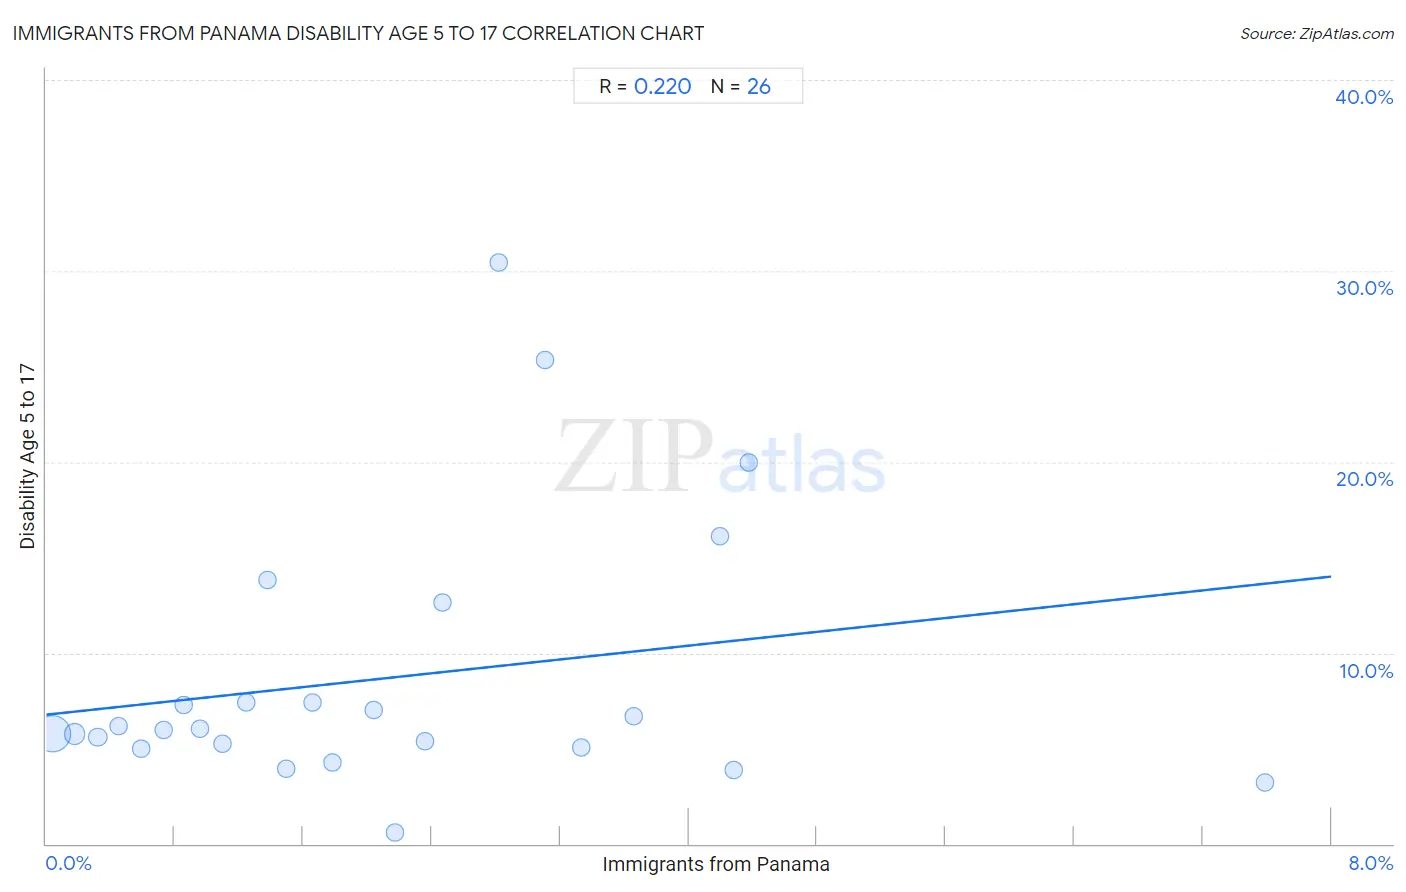
Immigrants from Panama Disability Age 5 to 17 Correlation Chart
The statistical analysis conducted on geographies consisting of 220,612,893 people shows a weak positive correlation between the proportion of Immigrants from Panama and percentage of population with a disability between the ages 5 and 17 in the United States with a correlation coefficient (R) of 0.220 and weighted average of 5.8%. On average, for every 1% (one percent) increase in Immigrants from Panama within a typical geography, there is an increase of 0.90% in percentage of population with a disability between the ages 5 and 17.
It is essential to understand that the correlation between the percentage of Immigrants from Panama and percentage of population with a disability between the ages 5 and 17 does not imply a direct cause-and-effect relationship. It remains uncertain whether the presence of Immigrants from Panama influences an upward or downward trend in the level of percentage of population with a disability between the ages 5 and 17 within an area, or if Immigrants from Panama simply ended up residing in those areas with higher or lower levels of percentage of population with a disability between the ages 5 and 17 due to other factors.
Demographics Similar to Immigrants from Panama by Disability Age 5 to 17
In terms of disability age 5 to 17, the demographic groups most similar to Immigrants from Panama are Immigrants from Cameroon (5.8%, a difference of 0.050%), Immigrants from Morocco (5.8%, a difference of 0.050%), Yugoslavian (5.8%, a difference of 0.070%), Swedish (5.8%, a difference of 0.090%), and Immigrants from Haiti (5.8%, a difference of 0.12%).
| Demographics | Rating | Rank | Disability Age 5 to 17 |
| Trinidadians and Tobagonians | 10.8 /100 | #205 | Poor 5.7% |
| Immigrants from Africa | 10.8 /100 | #206 | Poor 5.7% |
| Moroccans | 10.4 /100 | #207 | Poor 5.7% |
| Kenyans | 10.0 /100 | #208 | Poor 5.8% |
| Immigrants from Uganda | 9.7 /100 | #209 | Tragic 5.8% |
| Immigrants from Haiti | 9.5 /100 | #210 | Tragic 5.8% |
| Yugoslavians | 9.1 /100 | #211 | Tragic 5.8% |
| Immigrants from Panama | 8.7 /100 | #212 | Tragic 5.8% |
| Immigrants from Cameroon | 8.3 /100 | #213 | Tragic 5.8% |
| Immigrants from Morocco | 8.3 /100 | #214 | Tragic 5.8% |
| Swedes | 8.1 /100 | #215 | Tragic 5.8% |
| Nigerians | 7.5 /100 | #216 | Tragic 5.8% |
| Czechs | 7.4 /100 | #217 | Tragic 5.8% |
| Immigrants from Sierra Leone | 7.1 /100 | #218 | Tragic 5.8% |
| Sierra Leoneans | 7.0 /100 | #219 | Tragic 5.8% |
Immigrants from Panama Disability Age 5 to 17 Correlation Summary
| Measurement | Immigrants from Panama Data | Disability Age 5 to 17 Data |
| Minimum | 0.042% | 0.56% |
| Maximum | 7.6% | 30.4% |
| Range | 7.5% | 29.9% |
| Mean | 2.1% | 8.7% |
| Median | 1.7% | 6.0% |
| Interquartile 25% (IQ1) | 0.85% | 5.0% |
| Interquartile 75% (IQ3) | 3.1% | 7.4% |
| Interquartile Range (IQR) | 2.3% | 2.4% |
| Standard Deviation (Sample) | 1.7% | 7.1% |
| Standard Deviation (Population) | 1.7% | 6.9% |
Correlation Details
| Immigrants from Panama Percentile | Sample Size | Disability Age 5 to 17 |
[ 0.0% - 0.5% ] 0.042% | 177,080,607 | 5.8% |
[ 0.0% - 0.5% ] 0.18% | 30,428,265 | 5.7% |
[ 0.0% - 0.5% ] 0.32% | 6,742,709 | 5.6% |
[ 0.0% - 0.5% ] 0.45% | 3,048,682 | 6.1% |
[ 0.5% - 1.0% ] 0.59% | 1,434,619 | 5.0% |
[ 0.5% - 1.0% ] 0.73% | 898,432 | 5.9% |
[ 0.5% - 1.0% ] 0.85% | 281,647 | 7.3% |
[ 0.5% - 1.0% ] 0.96% | 231,988 | 6.0% |
[ 1.0% - 1.5% ] 1.10% | 166,135 | 5.2% |
[ 1.0% - 1.5% ] 1.24% | 162,541 | 7.4% |
[ 1.0% - 1.5% ] 1.38% | 3,126 | 13.8% |
[ 1.0% - 1.5% ] 1.49% | 31,987 | 3.9% |
[ 1.5% - 2.0% ] 1.66% | 17,942 | 7.4% |
[ 1.5% - 2.0% ] 1.78% | 35,147 | 4.3% |
[ 2.0% - 2.5% ] 2.04% | 12,147 | 7.0% |
[ 2.0% - 2.5% ] 2.17% | 3,869 | 0.56% |
[ 2.0% - 2.5% ] 2.36% | 19,216 | 5.3% |
[ 2.0% - 2.5% ] 2.47% | 1,460 | 12.6% |
[ 2.5% - 3.0% ] 2.82% | 142 | 30.4% |
[ 3.0% - 3.5% ] 3.11% | 644 | 25.3% |
[ 3.0% - 3.5% ] 3.33% | 7,299 | 5.0% |
[ 3.5% - 4.0% ] 3.66% | 1,258 | 6.7% |
[ 4.0% - 4.5% ] 4.19% | 1,002 | 16.1% |
[ 4.0% - 4.5% ] 4.28% | 1,332 | 3.8% |
[ 4.0% - 4.5% ] 4.37% | 183 | 20.0% |
[ 7.5% - 8.0% ] 7.59% | 514 | 3.2% |