Tlingit-Haida 4 or more Vehicles in Household

COMPARE

Tlingit-Haida
Race
Ancestry
AfghanAfricanAlaska NativeAlaskan AthabascanAlbanianAleutAlsatianAmericanApacheArabArapahoArgentineanArmenianAssyrian/Chaldean/SyriacAustralianAustrianBahamianBangladeshiBarbadianBasqueBelgianBelizeanBermudanBhutaneseBlackfeetBolivianBrazilianBritishBritish West IndianBulgarianBurmeseCajunCambodianCanadianCape VerdeanCarpatho RusynCelticCentral AmericanCentral American IndianCherokeeCheyenneChickasawChileanChineseChippewaChoctawColombianColvilleComancheCosta RicanCreeCreekCroatianCrowCubanCypriotCzechCzechoslovakianDanishDelawareDominicanDutchDutch West IndianEastern EuropeanEcuadorianEgyptianEnglishEstonianEthiopianEuropeanFijianFilipinoFinnishFrenchFrench American IndianFrench CanadianGermanGerman RussianGhanaianGreekGuamanian/ChamorroGuatemalanGuyaneseHaitianHmongHonduranHopiHoumaHungarianIcelanderIndian (Asian)IndonesianInupiatIranianIraqiIrishIroquoisIsraeliItalianJamaicanJapaneseJordanianKenyanKiowaKoreanLaotianLatvianLebaneseLiberianLithuanianLumbeeLuxembourgerMacedonianMalaysianMalteseMarshalleseMenomineeMexicanMexican American IndianMongolianMoroccanNative HawaiianNavajoNepaleseNew ZealanderNicaraguanNigerianNorthern EuropeanNorwegianOkinawanOsageOttawaPaiutePakistaniPalestinianPanamanianParaguayanPennsylvania GermanPeruvianPimaPolishPortuguesePotawatomiPuebloPuerto RicanPuget Sound SalishRomanianRussianSalvadoranSamoanScandinavianScotch-IrishScottishSeminoleSenegaleseSerbianShoshoneSierra LeoneanSiouxSlavicSlovakSloveneSomaliSouth AfricanSouth AmericanSouth American IndianSoviet UnionSpaniardSpanishSpanish AmericanSpanish American IndianSri LankanSubsaharan AfricanSudaneseSwedishSwissSyrianTaiwaneseThaiTlingit-HaidaTohono O'OdhamTonganTrinidadian and TobagonianTsimshianTurkishU.S. Virgin IslanderUgandanUkrainianUruguayanUteVenezuelanVietnameseWelshWest IndianYakamaYaquiYugoslavianYumanYup'ikZimbabwean
Immigration
NonimmigrantsImmigrantsAfghanistanAfricaAlbaniaArgentinaArmeniaAsiaAustraliaAustriaBahamasBangladeshBarbadosBelarusBelgiumBelizeBoliviaBosnia and HerzegovinaBrazilBulgariaBurma/MyanmarCabo VerdeCambodiaCameroonCanadaCaribbeanCentral AmericaChileChinaColombiaCongoCosta RicaCroatiaCubaCzechoslovakiaDenmarkDominicaDominican RepublicEastern AfricaEastern AsiaEastern EuropeEcuadorEgyptEl SalvadorEnglandEritreaEthiopiaEuropeFijiFranceGermanyGhanaGreeceGrenadaGuatemalaGuyanaHaitiHondurasHong KongHungaryIndiaIndonesiaIranIraqIrelandIsraelItalyJamaicaJapanJordanKazakhstanKenyaKoreaKuwaitLaosLatin AmericaLatviaLebanonLiberiaLithuaniaMalaysiaMexicoMicronesiaMiddle AfricaMoldovaMoroccoNepalNetherlandsNicaraguaNigeriaNorth AmericaNorth MacedoniaNorthern AfricaNorthern EuropeNorwayOceaniaPakistanPanamaPeruPhilippinesPolandPortugalRomaniaRussiaSaudi ArabiaScotlandSenegalSerbiaSierra LeoneSingaporeSomaliaSouth AfricaSouth AmericaSouth Central AsiaSouth Eastern AsiaSouthern EuropeSpainSri LankaSt. Vincent and the GrenadinesSudanSwedenSwitzerlandSyriaTaiwanThailandTrinidad and TobagoTurkeyUgandaUkraineUruguayUzbekistanVenezuelaVietnamWest IndiesWestern AfricaWestern AsiaWestern EuropeYemenZaireZimbabweAzores
Select to Compare
Race
Ancestry
AfghanAfricanAlaska NativeAlaskan AthabascanAlbanianAleutAlsatianAmericanApacheArabArapahoArgentineanArmenianAssyrian/Chaldean/SyriacAustralianAustrianBahamianBangladeshiBarbadianBasqueBelgianBelizeanBermudanBhutaneseBlackfeetBolivianBrazilianBritishBritish West IndianBulgarianBurmeseCajunCambodianCanadianCape VerdeanCarpatho RusynCelticCentral AmericanCentral American IndianCherokeeCheyenneChickasawChileanChineseChippewaChoctawColombianColvilleComancheCosta RicanCreeCreekCroatianCrowCubanCypriotCzechCzechoslovakianDanishDelawareDominicanDutchDutch West IndianEastern EuropeanEcuadorianEgyptianEnglishEstonianEthiopianEuropeanFijianFilipinoFinnishFrenchFrench American IndianFrench CanadianGermanGerman RussianGhanaianGreekGuamanian/ChamorroGuatemalanGuyaneseHaitianHmongHonduranHopiHoumaHungarianIcelanderIndian (Asian)IndonesianInupiatIranianIraqiIrishIroquoisIsraeliItalianJamaicanJapaneseJordanianKenyanKiowaKoreanLaotianLatvianLebaneseLiberianLithuanianLumbeeLuxembourgerMacedonianMalaysianMalteseMarshalleseMenomineeMexicanMexican American IndianMongolianMoroccanNative HawaiianNavajoNepaleseNew ZealanderNicaraguanNigerianNorthern EuropeanNorwegianOkinawanOsageOttawaPaiutePakistaniPalestinianPanamanianParaguayanPennsylvania GermanPeruvianPimaPolishPortuguesePotawatomiPuebloPuerto RicanPuget Sound SalishRomanianRussianSalvadoranSamoanScandinavianScotch-IrishScottishSeminoleSenegaleseSerbianShoshoneSierra LeoneanSiouxSlavicSlovakSloveneSomaliSouth AfricanSouth AmericanSouth American IndianSoviet UnionSpaniardSpanishSpanish AmericanSpanish American IndianSri LankanSubsaharan AfricanSudaneseSwedishSwissSyrianTaiwaneseThaiTohono O'OdhamTonganTrinidadian and TobagonianTsimshianTurkishU.S. Virgin IslanderUgandanUkrainianUruguayanUteVenezuelanVietnameseWelshWest IndianYakamaYaquiYugoslavianYumanYup'ikZimbabwean
Immigration
NonimmigrantsImmigrantsAfghanistanAfricaAlbaniaArgentinaArmeniaAsiaAustraliaAustriaBahamasBangladeshBarbadosBelarusBelgiumBelizeBoliviaBosnia and HerzegovinaBrazilBulgariaBurma/MyanmarCabo VerdeCambodiaCameroonCanadaCaribbeanCentral AmericaChileChinaColombiaCongoCosta RicaCroatiaCubaCzechoslovakiaDenmarkDominicaDominican RepublicEastern AfricaEastern AsiaEastern EuropeEcuadorEgyptEl SalvadorEnglandEritreaEthiopiaEuropeFijiFranceGermanyGhanaGreeceGrenadaGuatemalaGuyanaHaitiHondurasHong KongHungaryIndiaIndonesiaIranIraqIrelandIsraelItalyJamaicaJapanJordanKazakhstanKenyaKoreaKuwaitLaosLatin AmericaLatviaLebanonLiberiaLithuaniaMalaysiaMexicoMicronesiaMiddle AfricaMoldovaMoroccoNepalNetherlandsNicaraguaNigeriaNorth AmericaNorth MacedoniaNorthern AfricaNorthern EuropeNorwayOceaniaPakistanPanamaPeruPhilippinesPolandPortugalRomaniaRussiaSaudi ArabiaScotlandSenegalSerbiaSierra LeoneSingaporeSomaliaSouth AfricaSouth AmericaSouth Central AsiaSouth Eastern AsiaSouthern EuropeSpainSri LankaSt. Vincent and the GrenadinesSudanSwedenSwitzerlandSyriaTaiwanThailandTrinidad and TobagoTurkeyUgandaUkraineUruguayUzbekistanVenezuelaVietnamWest IndiesWestern AfricaWestern AsiaWestern EuropeYemenZaireZimbabweAzores
4 or more Vehicles in Household
Income
Poverty
Unemployment
Labor Participation
Family Structure
Vehicle Availability
Education Level
Disability

Tlingit-Haida 4 or more Vehicles in Household
Exceptional

6.8%
4+ VEHICLES AVAILABLE
96.2/ 100
METRIC RATING
115th/ 347
METRIC RANK

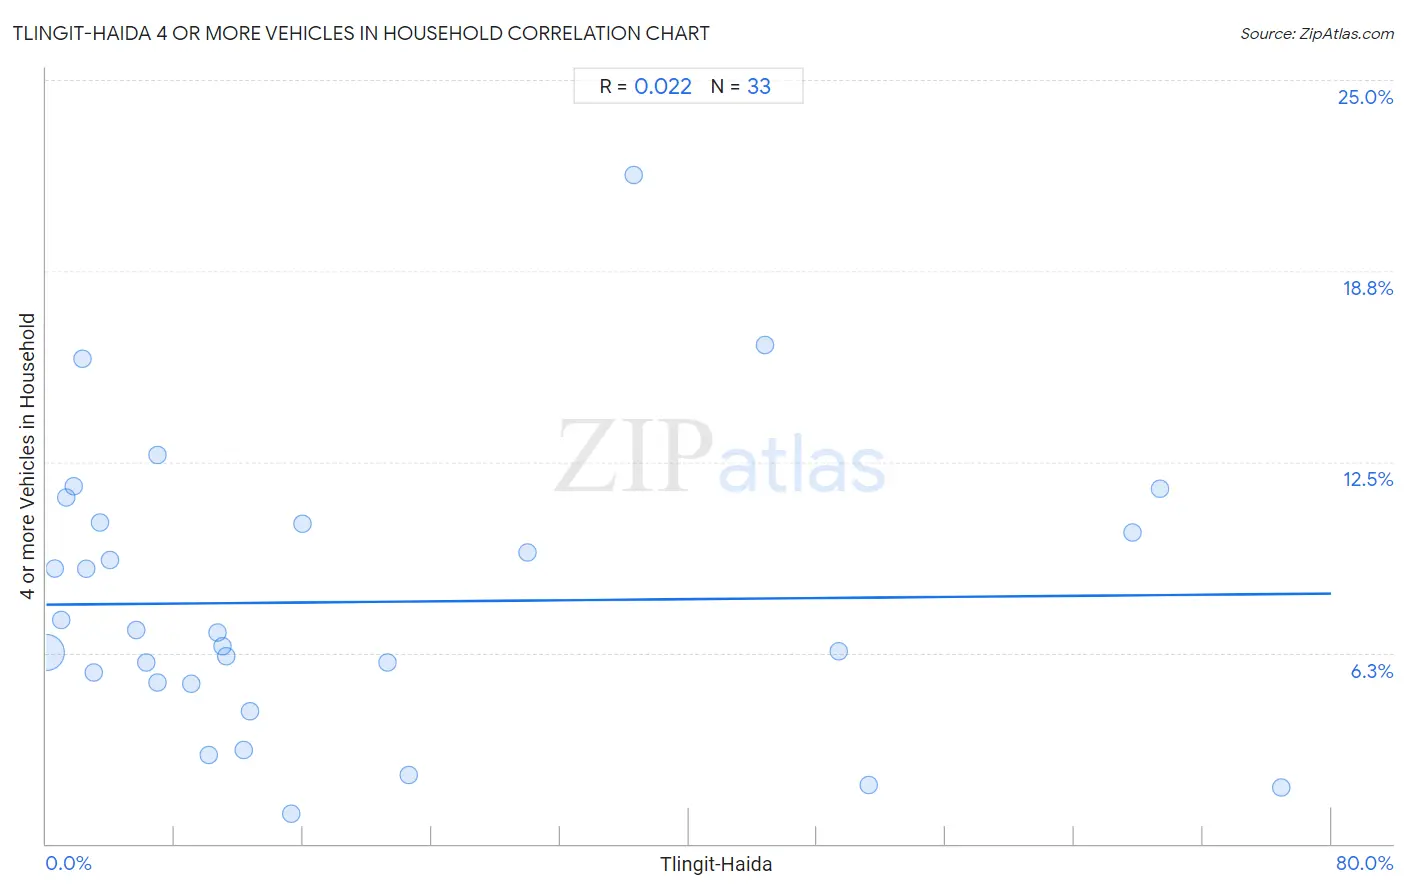
Tlingit-Haida 4 or more Vehicles in Household Correlation Chart

The statistical analysis conducted on geographies consisting of 60,810,933 people shows no correlation between the proportion of Tlingit-Haida and percentage of households with 4 or more vehicles available in the United States with a correlation coefficient (R) of 0.022 and weighted average of 6.8%. On average, for every 1% (one percent) increase in Tlingit-Haida within a typical geography, there is an increase of 0.0045% in percentage of households with 4 or more vehicles available.
Tlingit-Haida 4 or more Vehicles in Household
It is essential to understand that the correlation between the percentage of Tlingit-Haida and percentage of households with 4 or more vehicles available does not imply a direct cause-and-effect relationship. It remains uncertain whether the presence of Tlingit-Haida influences an upward or downward trend in the level of percentage of households with 4 or more vehicles available within an area, or if Tlingit-Haida simply ended up residing in those areas with higher or lower levels of percentage of households with 4 or more vehicles available due to other factors.

Demographics Similar to Tlingit-Haida by 4 or more Vehicles in Household

In terms of 4 or more vehicles in household, the demographic groups most similar to Tlingit-Haida are Bolivian (6.8%, a difference of 0.060%), Canadian (6.9%, a difference of 0.11%), Immigrants from Guatemala (6.8%, a difference of 0.26%), Burmese (6.8%, a difference of 0.28%), and French American Indian (6.8%, a difference of 0.28%).
DemographicsRating | Rank4 or more Vehicles in Household
French
97.7
/100
|
#108
Exceptional
6.9%
Filipinos
97.6
/100
|
#109
Exceptional
6.9%
Immigrants from Thailand
97.0
/100
|
#110
Exceptional
6.9%
Aleuts
97.0
/100
|
#111
Exceptional
6.9%
Hopi
97.0
/100
|
#112
Exceptional
6.9%
Canadians
96.4
/100
|
#113
Exceptional
6.9%
Bolivians
96.3
/100
|
#114
Exceptional
6.8%
Tlingit-Haida
96.2
/100
|
#115
Exceptional
6.8%
Immigrants from Guatemala
95.8
/100
|
#116
Exceptional
6.8%
Burmese
95.7
/100
|
#117
Exceptional
6.8%
French American Indians
95.7
/100
|
#118
Exceptional
6.8%
Costa Ricans
95.5
/100
|
#119
Exceptional
6.8%
Comanche
94.8
/100
|
#120
Exceptional
6.8%
Immigrants from Germany
94.7
/100
|
#121
Exceptional
6.8%
Immigrants from Nicaragua
94.7
/100
|
#122
Exceptional
6.8%

Tlingit-Haida 4 or more Vehicles in Household Correlation Summary

MeasurementTlingit-Haida Data4 or more Vehicles in Household Data
Minimum0.036%0.99%
Maximum76.8%21.9%
Range76.8%20.9%
Mean18.9%7.9%
Median10.7%6.9%
Interquartile 25% (IQ1)3.1%5.3%
Interquartile 75% (IQ3)26.3%10.5%
Interquartile Range (IQR)23.1%5.2%
Standard Deviation (Sample)21.9%4.6%
Standard Deviation (Population)21.6%4.5%

Correlation Details

Tlingit-Haida PercentileSample Size4 or more Vehicles in Household
[
0.0%
-
0.5%
]
0.036%
58,986,0786.3%
[
0.5%
-
1.0%
]
0.54%
1,307,8069.0%
[
0.5%
-
1.0%
]
0.91%
246,8107.3%
[
1.0%
-
1.5%
]
1.24%
85,68711.3%
[
1.5%
-
2.0%
]
1.71%
23,26311.7%
[
2.0%
-
2.5%
]
2.28%
8,44715.9%
[
2.0%
-
2.5%
]
2.46%
3,6559.0%
[
2.5%
-
3.0%
]
2.92%
6,2315.6%
[
3.0%
-
3.5%
]
3.33%
10,14610.5%
[
3.5%
-
4.0%
]
3.94%
1,4209.3%
[
5.5%
-
6.0%
]
5.62%
1,7627.0%
[
6.0%
-
6.5%
]
6.21%
1776.0%
[
6.5%
-
7.0%
]
6.91%
56412.7%
[
6.5%
-
7.0%
]
6.94%
2,1465.3%
[
8.5%
-
9.0%
]
9.00%
6,6915.2%
[
10.0%
-
10.5%
]
10.13%
2,9022.9%
[
10.5%
-
11.0%
]
10.70%
29,9336.9%
[
11.0%
-
11.5%
]
11.00%
32,1086.5%
[
11.0%
-
11.5%
]
11.18%
13,9136.1%
[
12.0%
-
12.5%
]
12.27%
16,9193.1%
[
12.5%
-
13.0%
]
12.67%
8,1684.3%
[
15.0%
-
15.5%
]
15.26%
2,1690.99%
[
15.5%
-
16.0%
]
15.92%
1,72710.5%
[
21.0%
-
21.5%
]
21.23%
4,2675.9%
[
22.5%
-
23.0%
]
22.55%
1,0732.2%
[
29.5%
-
30.0%
]
29.96%
1,1289.5%
[
36.5%
-
37.0%
]
36.59%
8221.9%
[
44.5%
-
45.0%
]
44.78%
92016.3%
[
49.0%
-
49.5%
]
49.33%
1,7926.3%
[
51.0%
-
51.5%
]
51.24%
8041.9%
[
67.5%
-
68.0%
]
67.59%
36110.2%
[
69.0%
-
69.5%
]
69.34%
94611.6%
[
76.5%
-
77.0%
]
76.85%
8381.9%