Subsaharan African Disability Age 5 to 17
COMPARE
Subsaharan African
Select to Compare
Disability Age 5 to 17
Subsaharan African Disability Age 5 to 17
6.2%
DISABILITY | AGE 5 TO 17
0.0/ 100
METRIC RATING
284th/ 347
METRIC RANK
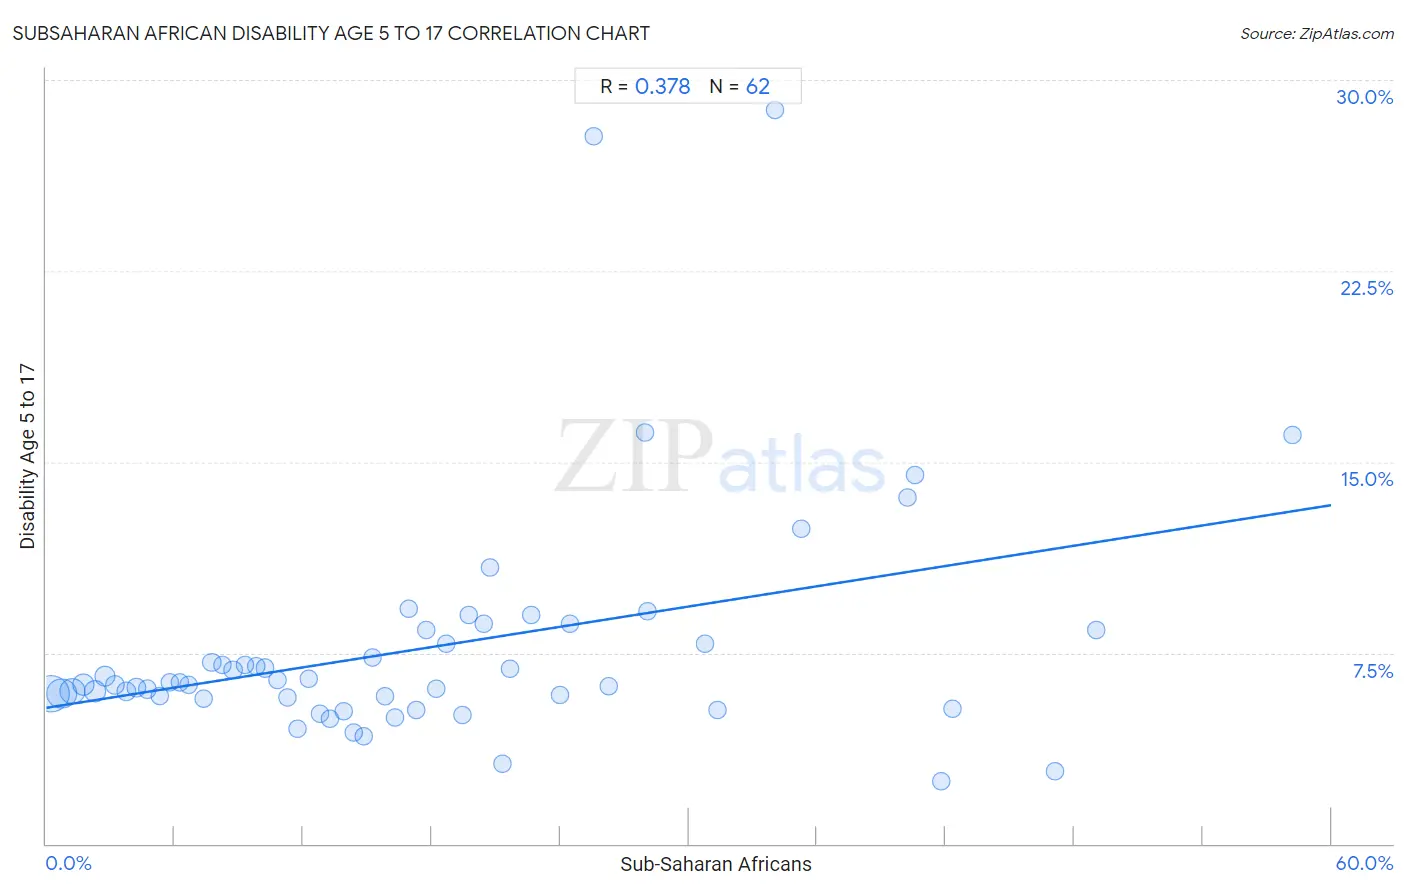
Subsaharan African Disability Age 5 to 17 Correlation Chart
The statistical analysis conducted on geographies consisting of 502,132,058 people shows a mild positive correlation between the proportion of Sub-Saharan Africans and percentage of population with a disability between the ages 5 and 17 in the United States with a correlation coefficient (R) of 0.378 and weighted average of 6.2%. On average, for every 1% (one percent) increase in Sub-Saharan Africans within a typical geography, there is an increase of 0.13% in percentage of population with a disability between the ages 5 and 17.
It is essential to understand that the correlation between the percentage of Sub-Saharan Africans and percentage of population with a disability between the ages 5 and 17 does not imply a direct cause-and-effect relationship. It remains uncertain whether the presence of Sub-Saharan Africans influences an upward or downward trend in the level of percentage of population with a disability between the ages 5 and 17 within an area, or if Sub-Saharan Africans simply ended up residing in those areas with higher or lower levels of percentage of population with a disability between the ages 5 and 17 due to other factors.
Demographics Similar to Sub-Saharan Africans by Disability Age 5 to 17
In terms of disability age 5 to 17, the demographic groups most similar to Sub-Saharan Africans are English (6.2%, a difference of 0.0%), Ugandan (6.2%, a difference of 0.030%), Colville (6.2%, a difference of 0.040%), German (6.1%, a difference of 0.19%), and Pima (6.2%, a difference of 0.23%).
| Demographics | Rating | Rank | Disability Age 5 to 17 |
| Puget Sound Salish | 0.1 /100 | #277 | Tragic 6.1% |
| Immigrants from Liberia | 0.1 /100 | #278 | Tragic 6.1% |
| Immigrants from Jamaica | 0.1 /100 | #279 | Tragic 6.1% |
| Portuguese | 0.1 /100 | #280 | Tragic 6.1% |
| Scottish | 0.0 /100 | #281 | Tragic 6.1% |
| Germans | 0.0 /100 | #282 | Tragic 6.1% |
| Ugandans | 0.0 /100 | #283 | Tragic 6.2% |
| Sub-Saharan Africans | 0.0 /100 | #284 | Tragic 6.2% |
| English | 0.0 /100 | #285 | Tragic 6.2% |
| Colville | 0.0 /100 | #286 | Tragic 6.2% |
| Pima | 0.0 /100 | #287 | Tragic 6.2% |
| Jamaicans | 0.0 /100 | #288 | Tragic 6.2% |
| Yaqui | 0.0 /100 | #289 | Tragic 6.2% |
| Immigrants from Congo | 0.0 /100 | #290 | Tragic 6.2% |
| Whites/Caucasians | 0.0 /100 | #291 | Tragic 6.2% |
Subsaharan African Disability Age 5 to 17 Correlation Summary
| Measurement | Subsaharan African Data | Disability Age 5 to 17 Data |
| Minimum | 0.24% | 2.5% |
| Maximum | 58.2% | 28.8% |
| Range | 57.9% | 26.3% |
| Mean | 18.0% | 7.7% |
| Median | 15.5% | 6.3% |
| Interquartile 25% (IQ1) | 7.7% | 5.7% |
| Interquartile 75% (IQ3) | 24.4% | 8.4% |
| Interquartile Range (IQR) | 16.7% | 2.7% |
| Standard Deviation (Sample) | 13.3% | 4.7% |
| Standard Deviation (Population) | 13.2% | 4.6% |
Correlation Details
| Subsaharan African Percentile | Sample Size | Disability Age 5 to 17 |
[ 0.0% - 0.5% ] 0.24% | 170,137,749 | 5.9% |
[ 0.5% - 1.0% ] 0.72% | 105,716,664 | 5.9% |
[ 1.0% - 1.5% ] 1.24% | 70,057,869 | 6.0% |
[ 1.5% - 2.0% ] 1.73% | 40,775,464 | 6.3% |
[ 2.0% - 2.5% ] 2.25% | 34,066,602 | 6.0% |
[ 2.5% - 3.0% ] 2.72% | 23,214,956 | 6.6% |
[ 3.0% - 3.5% ] 3.23% | 13,102,867 | 6.2% |
[ 3.5% - 4.0% ] 3.75% | 9,200,602 | 6.0% |
[ 4.0% - 4.5% ] 4.22% | 8,795,668 | 6.1% |
[ 4.5% - 5.0% ] 4.71% | 4,023,471 | 6.1% |
[ 5.0% - 5.5% ] 5.29% | 3,734,606 | 5.8% |
[ 5.5% - 6.0% ] 5.77% | 3,251,425 | 6.3% |
[ 6.0% - 6.5% ] 6.26% | 2,171,992 | 6.3% |
[ 6.5% - 7.0% ] 6.66% | 2,494,266 | 6.2% |
[ 7.0% - 7.5% ] 7.34% | 1,463,355 | 5.7% |
[ 7.5% - 8.0% ] 7.73% | 1,538,693 | 7.1% |
[ 8.0% - 8.5% ] 8.23% | 950,775 | 7.0% |
[ 8.5% - 9.0% ] 8.72% | 983,150 | 6.8% |
[ 9.0% - 9.5% ] 9.27% | 856,714 | 7.0% |
[ 9.5% - 10.0% ] 9.78% | 404,704 | 7.0% |
[ 10.0% - 10.5% ] 10.21% | 742,156 | 6.9% |
[ 10.5% - 11.0% ] 10.78% | 510,233 | 6.4% |
[ 11.0% - 11.5% ] 11.27% | 651,401 | 5.7% |
[ 11.5% - 12.0% ] 11.75% | 270,679 | 4.5% |
[ 12.0% - 12.5% ] 12.27% | 96,380 | 6.5% |
[ 12.5% - 13.0% ] 12.77% | 184,064 | 5.1% |
[ 13.0% - 13.5% ] 13.23% | 435,504 | 4.9% |
[ 13.5% - 14.0% ] 13.91% | 340,793 | 5.2% |
[ 14.0% - 14.5% ] 14.38% | 83,868 | 4.4% |
[ 14.5% - 15.0% ] 14.81% | 132,014 | 4.2% |
[ 15.0% - 15.5% ] 15.21% | 224,032 | 7.3% |
[ 15.5% - 16.0% ] 15.83% | 211,903 | 5.8% |
[ 16.0% - 16.5% ] 16.26% | 187,796 | 5.0% |
[ 16.5% - 17.0% ] 16.92% | 25,371 | 9.2% |
[ 17.0% - 17.5% ] 17.26% | 143,733 | 5.2% |
[ 17.5% - 18.0% ] 17.73% | 65,899 | 8.4% |
[ 18.0% - 18.5% ] 18.20% | 220,571 | 6.1% |
[ 18.5% - 19.0% ] 18.66% | 97,301 | 7.9% |
[ 19.0% - 19.5% ] 19.43% | 242,816 | 5.1% |
[ 19.5% - 20.0% ] 19.74% | 19,112 | 9.0% |
[ 20.0% - 20.5% ] 20.42% | 36,389 | 8.6% |
[ 20.5% - 21.0% ] 20.73% | 34,686 | 10.9% |
[ 21.0% - 21.5% ] 21.32% | 25,224 | 3.1% |
[ 21.5% - 22.0% ] 21.64% | 51,538 | 6.9% |
[ 22.5% - 23.0% ] 22.67% | 37,618 | 9.0% |
[ 23.5% - 24.0% ] 23.99% | 14,553 | 5.8% |
[ 24.0% - 24.5% ] 24.44% | 24,795 | 8.7% |
[ 25.5% - 26.0% ] 25.54% | 881 | 27.8% |
[ 26.0% - 26.5% ] 26.24% | 2,069 | 6.2% |
[ 27.5% - 28.0% ] 27.93% | 512 | 16.2% |
[ 28.0% - 28.5% ] 28.06% | 29,898 | 9.1% |
[ 30.5% - 31.0% ] 30.74% | 15,489 | 7.9% |
[ 31.0% - 31.5% ] 31.35% | 2,485 | 5.2% |
[ 34.0% - 34.5% ] 34.01% | 1,476 | 28.8% |
[ 35.0% - 35.5% ] 35.23% | 1,286 | 12.4% |
[ 40.0% - 40.5% ] 40.22% | 4,572 | 13.6% |
[ 40.5% - 41.0% ] 40.56% | 9,613 | 14.5% |
[ 41.5% - 42.0% ] 41.76% | 613 | 2.5% |
[ 42.0% - 42.5% ] 42.31% | 338 | 5.3% |
[ 47.0% - 47.5% ] 47.10% | 1,157 | 2.8% |
[ 49.0% - 49.5% ] 49.02% | 9,074 | 8.4% |
[ 58.0% - 58.5% ] 58.19% | 574 | 16.0% |