Tlingit-Haida Single Father Households

COMPARE

Tlingit-Haida
Race
Ancestry
AfghanAfricanAlaska NativeAlaskan AthabascanAlbanianAleutAlsatianAmericanApacheArabArapahoArgentineanArmenianAssyrian/Chaldean/SyriacAustralianAustrianBahamianBangladeshiBarbadianBasqueBelgianBelizeanBermudanBhutaneseBlackfeetBolivianBrazilianBritishBritish West IndianBulgarianBurmeseCajunCambodianCanadianCape VerdeanCarpatho RusynCelticCentral AmericanCentral American IndianCherokeeCheyenneChickasawChileanChineseChippewaChoctawColombianColvilleComancheCosta RicanCreeCreekCroatianCrowCubanCypriotCzechCzechoslovakianDanishDelawareDominicanDutchDutch West IndianEastern EuropeanEcuadorianEgyptianEnglishEstonianEthiopianEuropeanFijianFilipinoFinnishFrenchFrench American IndianFrench CanadianGermanGerman RussianGhanaianGreekGuamanian/ChamorroGuatemalanGuyaneseHaitianHmongHonduranHopiHoumaHungarianIcelanderIndian (Asian)IndonesianInupiatIranianIraqiIrishIroquoisIsraeliItalianJamaicanJapaneseJordanianKenyanKiowaKoreanLaotianLatvianLebaneseLiberianLithuanianLumbeeLuxembourgerMacedonianMalaysianMalteseMarshalleseMenomineeMexicanMexican American IndianMongolianMoroccanNative HawaiianNavajoNepaleseNew ZealanderNicaraguanNigerianNorthern EuropeanNorwegianOkinawanOsageOttawaPaiutePakistaniPalestinianPanamanianParaguayanPennsylvania GermanPeruvianPimaPolishPortuguesePotawatomiPuebloPuerto RicanPuget Sound SalishRomanianRussianSalvadoranSamoanScandinavianScotch-IrishScottishSeminoleSenegaleseSerbianShoshoneSierra LeoneanSiouxSlavicSlovakSloveneSomaliSouth AfricanSouth AmericanSouth American IndianSoviet UnionSpaniardSpanishSpanish AmericanSpanish American IndianSri LankanSubsaharan AfricanSudaneseSwedishSwissSyrianTaiwaneseThaiTlingit-HaidaTohono O'OdhamTonganTrinidadian and TobagonianTsimshianTurkishU.S. Virgin IslanderUgandanUkrainianUruguayanUteVenezuelanVietnameseWelshWest IndianYakamaYaquiYugoslavianYumanYup'ikZimbabwean
Immigration
NonimmigrantsImmigrantsAfghanistanAfricaAlbaniaArgentinaArmeniaAsiaAustraliaAustriaBahamasBangladeshBarbadosBelarusBelgiumBelizeBoliviaBosnia and HerzegovinaBrazilBulgariaBurma/MyanmarCabo VerdeCambodiaCameroonCanadaCaribbeanCentral AmericaChileChinaColombiaCongoCosta RicaCroatiaCubaCzechoslovakiaDenmarkDominicaDominican RepublicEastern AfricaEastern AsiaEastern EuropeEcuadorEgyptEl SalvadorEnglandEritreaEthiopiaEuropeFijiFranceGermanyGhanaGreeceGrenadaGuatemalaGuyanaHaitiHondurasHong KongHungaryIndiaIndonesiaIranIraqIrelandIsraelItalyJamaicaJapanJordanKazakhstanKenyaKoreaKuwaitLaosLatin AmericaLatviaLebanonLiberiaLithuaniaMalaysiaMexicoMicronesiaMiddle AfricaMoldovaMoroccoNepalNetherlandsNicaraguaNigeriaNorth AmericaNorth MacedoniaNorthern AfricaNorthern EuropeNorwayOceaniaPakistanPanamaPeruPhilippinesPolandPortugalRomaniaRussiaSaudi ArabiaScotlandSenegalSerbiaSierra LeoneSingaporeSomaliaSouth AfricaSouth AmericaSouth Central AsiaSouth Eastern AsiaSouthern EuropeSpainSri LankaSt. Vincent and the GrenadinesSudanSwedenSwitzerlandSyriaTaiwanThailandTrinidad and TobagoTurkeyUgandaUkraineUruguayUzbekistanVenezuelaVietnamWest IndiesWestern AfricaWestern AsiaWestern EuropeYemenZaireZimbabweAzores
Select to Compare
Race
Ancestry
AfghanAfricanAlaska NativeAlaskan AthabascanAlbanianAleutAlsatianAmericanApacheArabArapahoArgentineanArmenianAssyrian/Chaldean/SyriacAustralianAustrianBahamianBangladeshiBarbadianBasqueBelgianBelizeanBermudanBhutaneseBlackfeetBolivianBrazilianBritishBritish West IndianBulgarianBurmeseCajunCambodianCanadianCape VerdeanCarpatho RusynCelticCentral AmericanCentral American IndianCherokeeCheyenneChickasawChileanChineseChippewaChoctawColombianColvilleComancheCosta RicanCreeCreekCroatianCrowCubanCypriotCzechCzechoslovakianDanishDelawareDominicanDutchDutch West IndianEastern EuropeanEcuadorianEgyptianEnglishEstonianEthiopianEuropeanFijianFilipinoFinnishFrenchFrench American IndianFrench CanadianGermanGerman RussianGhanaianGreekGuamanian/ChamorroGuatemalanGuyaneseHaitianHmongHonduranHopiHoumaHungarianIcelanderIndian (Asian)IndonesianInupiatIranianIraqiIrishIroquoisIsraeliItalianJamaicanJapaneseJordanianKenyanKiowaKoreanLaotianLatvianLebaneseLiberianLithuanianLumbeeLuxembourgerMacedonianMalaysianMalteseMarshalleseMenomineeMexicanMexican American IndianMongolianMoroccanNative HawaiianNavajoNepaleseNew ZealanderNicaraguanNigerianNorthern EuropeanNorwegianOkinawanOsageOttawaPaiutePakistaniPalestinianPanamanianParaguayanPennsylvania GermanPeruvianPimaPolishPortuguesePotawatomiPuebloPuerto RicanPuget Sound SalishRomanianRussianSalvadoranSamoanScandinavianScotch-IrishScottishSeminoleSenegaleseSerbianShoshoneSierra LeoneanSiouxSlavicSlovakSloveneSomaliSouth AfricanSouth AmericanSouth American IndianSoviet UnionSpaniardSpanishSpanish AmericanSpanish American IndianSri LankanSubsaharan AfricanSudaneseSwedishSwissSyrianTaiwaneseThaiTohono O'OdhamTonganTrinidadian and TobagonianTsimshianTurkishU.S. Virgin IslanderUgandanUkrainianUruguayanUteVenezuelanVietnameseWelshWest IndianYakamaYaquiYugoslavianYumanYup'ikZimbabwean
Immigration
NonimmigrantsImmigrantsAfghanistanAfricaAlbaniaArgentinaArmeniaAsiaAustraliaAustriaBahamasBangladeshBarbadosBelarusBelgiumBelizeBoliviaBosnia and HerzegovinaBrazilBulgariaBurma/MyanmarCabo VerdeCambodiaCameroonCanadaCaribbeanCentral AmericaChileChinaColombiaCongoCosta RicaCroatiaCubaCzechoslovakiaDenmarkDominicaDominican RepublicEastern AfricaEastern AsiaEastern EuropeEcuadorEgyptEl SalvadorEnglandEritreaEthiopiaEuropeFijiFranceGermanyGhanaGreeceGrenadaGuatemalaGuyanaHaitiHondurasHong KongHungaryIndiaIndonesiaIranIraqIrelandIsraelItalyJamaicaJapanJordanKazakhstanKenyaKoreaKuwaitLaosLatin AmericaLatviaLebanonLiberiaLithuaniaMalaysiaMexicoMicronesiaMiddle AfricaMoldovaMoroccoNepalNetherlandsNicaraguaNigeriaNorth AmericaNorth MacedoniaNorthern AfricaNorthern EuropeNorwayOceaniaPakistanPanamaPeruPhilippinesPolandPortugalRomaniaRussiaSaudi ArabiaScotlandSenegalSerbiaSierra LeoneSingaporeSomaliaSouth AfricaSouth AmericaSouth Central AsiaSouth Eastern AsiaSouthern EuropeSpainSri LankaSt. Vincent and the GrenadinesSudanSwedenSwitzerlandSyriaTaiwanThailandTrinidad and TobagoTurkeyUgandaUkraineUruguayUzbekistanVenezuelaVietnamWest IndiesWestern AfricaWestern AsiaWestern EuropeYemenZaireZimbabweAzores
Single Father Households
Income
Poverty
Unemployment
Labor Participation
Family Structure
Vehicle Availability
Education Level
Disability

Tlingit-Haida Single Father Households
Tragic

2.7%
SINGLE FATHER HOUSEHOLDS
0.0/ 100
METRIC RATING
289th/ 347
METRIC RANK

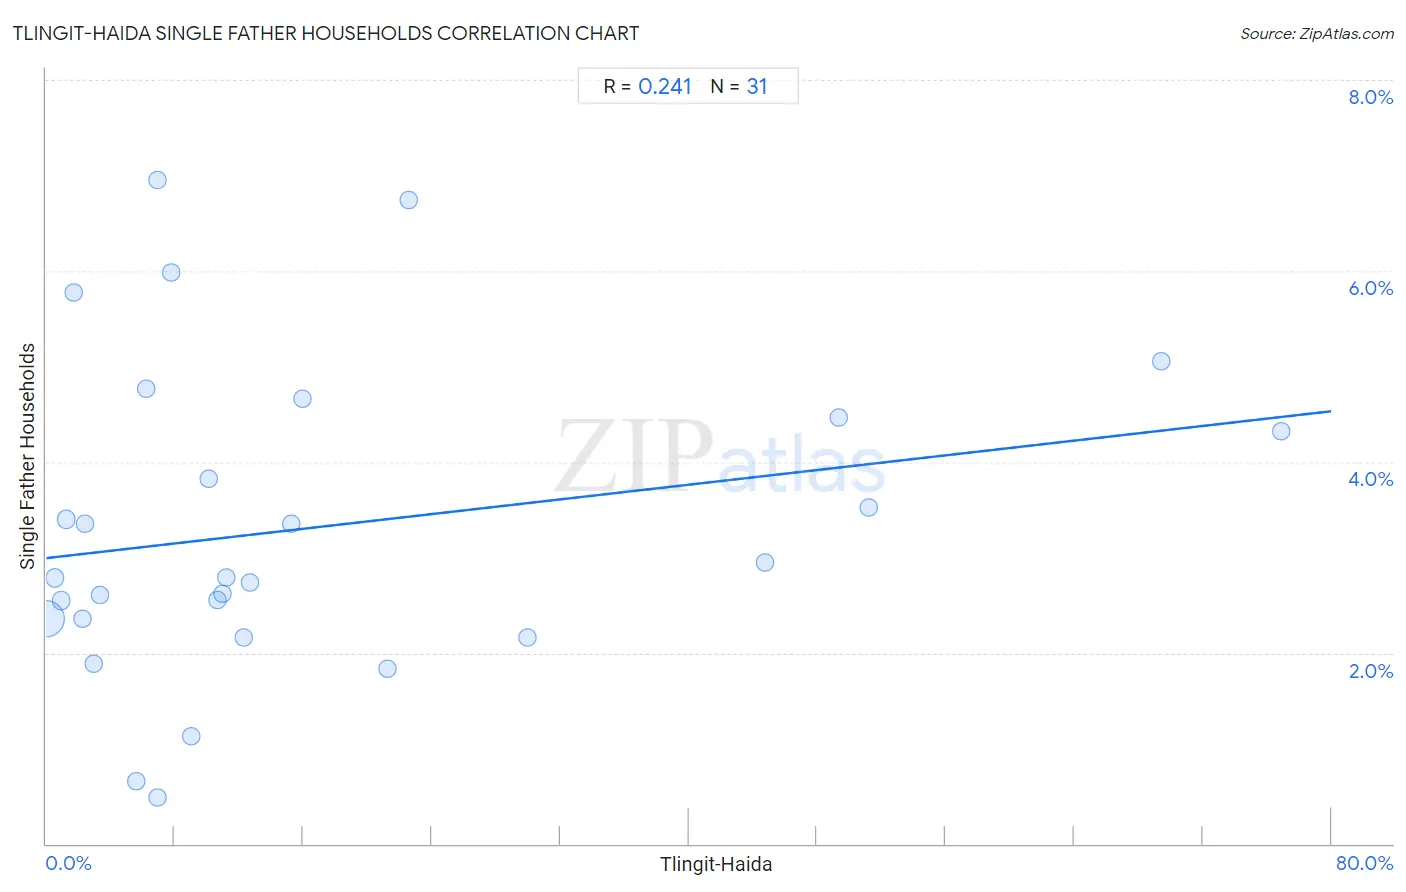
Tlingit-Haida Single Father Households Correlation Chart

The statistical analysis conducted on geographies consisting of 60,729,668 people shows a weak positive correlation between the proportion of Tlingit-Haida and percentage of single father households in the United States with a correlation coefficient (R) of 0.241 and weighted average of 2.7%. On average, for every 1% (one percent) increase in Tlingit-Haida within a typical geography, there is an increase of 0.019% in percentage of single father households.
Tlingit-Haida Single Father Households
It is essential to understand that the correlation between the percentage of Tlingit-Haida and percentage of single father households does not imply a direct cause-and-effect relationship. It remains uncertain whether the presence of Tlingit-Haida influences an upward or downward trend in the level of percentage of single father households within an area, or if Tlingit-Haida simply ended up residing in those areas with higher or lower levels of percentage of single father households due to other factors.

Demographics Similar to Tlingit-Haida by Single Father Households

In terms of single father households, the demographic groups most similar to Tlingit-Haida are Immigrants from Cambodia (2.7%, a difference of 0.060%), Central American Indian (2.7%, a difference of 0.31%), Puget Sound Salish (2.7%, a difference of 0.45%), Ottawa (2.7%, a difference of 0.47%), and Immigrants from Cuba (2.7%, a difference of 0.47%).
DemographicsRating | RankSingle Father Households
Dutch West Indians
0.1
/100
|
#282
Tragic
2.6%
Immigrants from Nicaragua
0.1
/100
|
#283
Tragic
2.7%
Hawaiians
0.1
/100
|
#284
Tragic
2.7%
Ottawa
0.1
/100
|
#285
Tragic
2.7%
Immigrants from Cuba
0.1
/100
|
#286
Tragic
2.7%
Central American Indians
0.0
/100
|
#287
Tragic
2.7%
Immigrants from Cambodia
0.0
/100
|
#288
Tragic
2.7%
Tlingit-Haida
0.0
/100
|
#289
Tragic
2.7%
Puget Sound Salish
0.0
/100
|
#290
Tragic
2.7%
Blackfeet
0.0
/100
|
#291
Tragic
2.7%
Choctaw
0.0
/100
|
#292
Tragic
2.7%
Immigrants from Fiji
0.0
/100
|
#293
Tragic
2.7%
Malaysians
0.0
/100
|
#294
Tragic
2.7%
Chickasaw
0.0
/100
|
#295
Tragic
2.8%
Japanese
0.0
/100
|
#296
Tragic
2.8%

Tlingit-Haida Single Father Households Correlation Summary

MeasurementTlingit-Haida DataSingle Father Households Data
Minimum0.036%0.49%
Maximum76.8%6.9%
Range76.8%6.5%
Mean16.9%3.3%
Median10.1%2.8%
Interquartile 25% (IQ1)3.0%2.4%
Interquartile 75% (IQ3)21.2%4.5%
Interquartile Range (IQR)18.3%2.1%
Standard Deviation (Sample)20.4%1.6%
Standard Deviation (Population)20.0%1.6%

Correlation Details

Tlingit-Haida PercentileSample SizeSingle Father Households
[
0.0%
-
0.5%
]
0.036%
58,940,9382.4%
[
0.5%
-
1.0%
]
0.55%
1,301,9382.8%
[
0.5%
-
1.0%
]
0.91%
235,3512.5%
[
1.0%
-
1.5%
]
1.23%
70,9813.4%
[
1.5%
-
2.0%
]
1.73%
22,0685.8%
[
2.0%
-
2.5%
]
2.28%
8,4472.4%
[
2.0%
-
2.5%
]
2.44%
2,1283.3%
[
2.5%
-
3.0%
]
2.95%
3,6891.9%
[
3.0%
-
3.5%
]
3.33%
10,1462.6%
[
5.5%
-
6.0%
]
5.62%
1,7620.65%
[
6.0%
-
6.5%
]
6.21%
1774.8%
[
6.5%
-
7.0%
]
6.91%
5646.9%
[
6.5%
-
7.0%
]
6.94%
2,1460.49%
[
7.5%
-
8.0%
]
7.80%
1,2576.0%
[
8.5%
-
9.0%
]
9.00%
6,6911.1%
[
10.0%
-
10.5%
]
10.13%
2,9023.8%
[
10.5%
-
11.0%
]
10.70%
29,9332.6%
[
11.0%
-
11.5%
]
11.00%
32,1082.6%
[
11.0%
-
11.5%
]
11.18%
13,9132.8%
[
12.0%
-
12.5%
]
12.26%
18,0412.2%
[
12.5%
-
13.0%
]
12.67%
8,1682.7%
[
15.0%
-
15.5%
]
15.26%
2,1693.4%
[
15.5%
-
16.0%
]
15.92%
1,7274.7%
[
21.0%
-
21.5%
]
21.23%
4,2671.8%
[
22.5%
-
23.0%
]
22.55%
1,0736.7%
[
29.5%
-
30.0%
]
29.96%
1,1282.2%
[
44.5%
-
45.0%
]
44.78%
9202.9%
[
49.0%
-
49.5%
]
49.33%
1,7924.5%
[
51.0%
-
51.5%
]
51.24%
8043.5%
[
69.0%
-
69.5%
]
69.41%
1,6025.1%
[
76.5%
-
77.0%
]
76.85%
8384.3%