Blackfeet Disability Age 5 to 17
COMPARE
Blackfeet
Select to Compare
Disability Age 5 to 17
Blackfeet Disability Age 5 to 17
6.6%
DISABILITY | AGE 5 TO 17
0.0/ 100
METRIC RATING
329th/ 347
METRIC RANK
Blackfeet Disability Age 5 to 17 Correlation Chart
The statistical analysis conducted on geographies consisting of 307,715,312 people shows a moderate negative correlation between the proportion of Blackfeet and percentage of population with a disability between the ages 5 and 17 in the United States with a correlation coefficient (R) of -0.481 and weighted average of 6.6%. On average, for every 1% (one percent) increase in Blackfeet within a typical geography, there is a decrease of 0.072% in percentage of population with a disability between the ages 5 and 17.
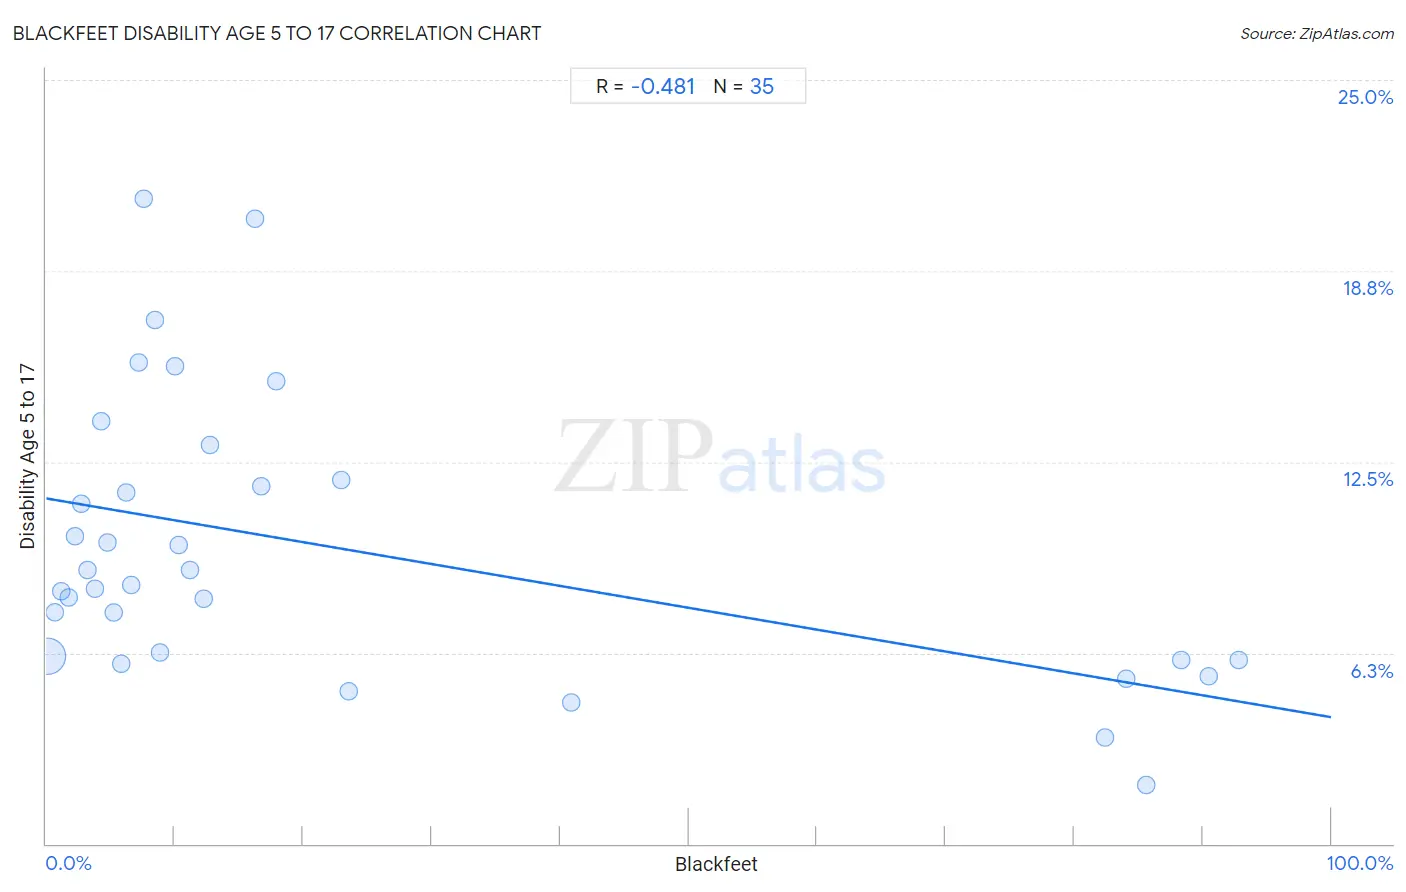
It is essential to understand that the correlation between the percentage of Blackfeet and percentage of population with a disability between the ages 5 and 17 does not imply a direct cause-and-effect relationship. It remains uncertain whether the presence of Blackfeet influences an upward or downward trend in the level of percentage of population with a disability between the ages 5 and 17 within an area, or if Blackfeet simply ended up residing in those areas with higher or lower levels of percentage of population with a disability between the ages 5 and 17 due to other factors.
Demographics Similar to Blackfeet by Disability Age 5 to 17
In terms of disability age 5 to 17, the demographic groups most similar to Blackfeet are Pennsylvania German (6.6%, a difference of 0.17%), French American Indian (6.6%, a difference of 0.40%), Potawatomi (6.5%, a difference of 0.84%), American (6.5%, a difference of 0.97%), and Dominican (6.5%, a difference of 1.0%).
| Demographics | Rating | Rank | Disability Age 5 to 17 |
| Slovaks | 0.0 /100 | #322 | Tragic 6.5% |
| Osage | 0.0 /100 | #323 | Tragic 6.5% |
| Dominicans | 0.0 /100 | #324 | Tragic 6.5% |
| Americans | 0.0 /100 | #325 | Tragic 6.5% |
| Potawatomi | 0.0 /100 | #326 | Tragic 6.5% |
| French American Indians | 0.0 /100 | #327 | Tragic 6.6% |
| Pennsylvania Germans | 0.0 /100 | #328 | Tragic 6.6% |
| Blackfeet | 0.0 /100 | #329 | Tragic 6.6% |
| Dutch West Indians | 0.0 /100 | #330 | Tragic 6.7% |
| French Canadians | 0.0 /100 | #331 | Tragic 6.7% |
| Immigrants from the Azores | 0.0 /100 | #332 | Tragic 6.7% |
| Blacks/African Americans | 0.0 /100 | #333 | Tragic 6.8% |
| Seminole | 0.0 /100 | #334 | Tragic 6.8% |
| Ottawa | 0.0 /100 | #335 | Tragic 6.8% |
| Chickasaw | 0.0 /100 | #336 | Tragic 6.8% |
Blackfeet Disability Age 5 to 17 Correlation Summary
| Measurement | Blackfeet Data | Disability Age 5 to 17 Data |
| Minimum | 0.087% | 1.9% |
| Maximum | 92.8% | 21.1% |
| Range | 92.7% | 19.2% |
| Mean | 22.8% | 9.7% |
| Median | 8.9% | 8.5% |
| Interquartile 25% (IQ1) | 4.3% | 6.0% |
| Interquartile 75% (IQ3) | 23.0% | 11.9% |
| Interquartile Range (IQR) | 18.7% | 5.9% |
| Standard Deviation (Sample) | 30.8% | 4.6% |
| Standard Deviation (Population) | 30.4% | 4.5% |
Correlation Details
| Blackfeet Percentile | Sample Size | Disability Age 5 to 17 |
[ 0.0% - 0.5% ] 0.087% | 299,438,011 | 6.1% |
[ 0.5% - 1.0% ] 0.68% | 6,334,441 | 7.6% |
[ 1.0% - 1.5% ] 1.20% | 899,419 | 8.3% |
[ 1.5% - 2.0% ] 1.72% | 633,274 | 8.1% |
[ 2.0% - 2.5% ] 2.21% | 190,477 | 10.1% |
[ 2.5% - 3.0% ] 2.68% | 66,978 | 11.1% |
[ 3.0% - 3.5% ] 3.23% | 36,425 | 9.0% |
[ 3.5% - 4.0% ] 3.77% | 26,279 | 8.3% |
[ 4.0% - 4.5% ] 4.29% | 26,879 | 13.8% |
[ 4.5% - 5.0% ] 4.73% | 3,063 | 9.9% |
[ 5.0% - 5.5% ] 5.27% | 3,703 | 7.6% |
[ 5.5% - 6.0% ] 5.86% | 9,305 | 5.9% |
[ 6.0% - 6.5% ] 6.26% | 7,345 | 11.5% |
[ 6.5% - 7.0% ] 6.64% | 3,478 | 8.5% |
[ 7.0% - 7.5% ] 7.18% | 2,229 | 15.8% |
[ 7.5% - 8.0% ] 7.63% | 3,002 | 21.1% |
[ 8.0% - 8.5% ] 8.45% | 1,799 | 17.1% |
[ 8.5% - 9.0% ] 8.85% | 576 | 6.2% |
[ 10.0% - 10.5% ] 10.00% | 160 | 15.6% |
[ 10.0% - 10.5% ] 10.32% | 853 | 9.8% |
[ 11.0% - 11.5% ] 11.19% | 2,538 | 9.0% |
[ 12.0% - 12.5% ] 12.26% | 106 | 8.0% |
[ 12.5% - 13.0% ] 12.72% | 173 | 13.0% |
[ 16.0% - 16.5% ] 16.28% | 1,253 | 20.4% |
[ 16.5% - 17.0% ] 16.74% | 227 | 11.7% |
[ 17.5% - 18.0% ] 17.94% | 3,061 | 15.1% |
[ 22.5% - 23.0% ] 22.98% | 5,008 | 11.9% |
[ 23.5% - 24.0% ] 23.53% | 85 | 5.0% |
[ 40.5% - 41.0% ] 40.90% | 863 | 4.6% |
[ 82.0% - 82.5% ] 82.35% | 1,654 | 3.5% |
[ 84.0% - 84.5% ] 84.09% | 7,532 | 5.4% |
[ 85.5% - 86.0% ] 85.65% | 871 | 1.9% |
[ 88.0% - 88.5% ] 88.34% | 3,001 | 6.0% |
[ 90.0% - 90.5% ] 90.43% | 690 | 5.5% |
[ 92.5% - 93.0% ] 92.78% | 554 | 6.0% |