Yakama Disability Age 5 to 17

COMPARE

Yakama
Race
Ancestry
AfghanAfricanAlaska NativeAlaskan AthabascanAlbanianAleutAlsatianAmericanApacheArabArapahoArgentineanArmenianAssyrian/Chaldean/SyriacAustralianAustrianBahamianBangladeshiBarbadianBasqueBelgianBelizeanBermudanBhutaneseBlackfeetBolivianBrazilianBritishBritish West IndianBulgarianBurmeseCajunCambodianCanadianCape VerdeanCarpatho RusynCelticCentral AmericanCentral American IndianCherokeeCheyenneChickasawChileanChineseChippewaChoctawColombianColvilleComancheCosta RicanCreeCreekCroatianCrowCubanCypriotCzechCzechoslovakianDanishDelawareDominicanDutchDutch West IndianEastern EuropeanEcuadorianEgyptianEnglishEstonianEthiopianEuropeanFijianFilipinoFinnishFrenchFrench American IndianFrench CanadianGermanGerman RussianGhanaianGreekGuamanian/ChamorroGuatemalanGuyaneseHaitianHmongHonduranHopiHoumaHungarianIcelanderIndian (Asian)IndonesianInupiatIranianIraqiIrishIroquoisIsraeliItalianJamaicanJapaneseJordanianKenyanKiowaKoreanLaotianLatvianLebaneseLiberianLithuanianLumbeeLuxembourgerMacedonianMalaysianMalteseMarshalleseMenomineeMexicanMexican American IndianMongolianMoroccanNative HawaiianNavajoNepaleseNew ZealanderNicaraguanNigerianNorthern EuropeanNorwegianOkinawanOsageOttawaPaiutePakistaniPalestinianPanamanianParaguayanPennsylvania GermanPeruvianPimaPolishPortuguesePotawatomiPuebloPuerto RicanPuget Sound SalishRomanianRussianSalvadoranSamoanScandinavianScotch-IrishScottishSeminoleSenegaleseSerbianShoshoneSierra LeoneanSiouxSlavicSlovakSloveneSomaliSouth AfricanSouth AmericanSouth American IndianSoviet UnionSpaniardSpanishSpanish AmericanSpanish American IndianSri LankanSubsaharan AfricanSudaneseSwedishSwissSyrianTaiwaneseThaiTlingit-HaidaTohono O'OdhamTonganTrinidadian and TobagonianTsimshianTurkishU.S. Virgin IslanderUgandanUkrainianUruguayanUteVenezuelanVietnameseWelshWest IndianYakamaYaquiYugoslavianYumanYup'ikZimbabwean
Immigration
NonimmigrantsImmigrantsAfghanistanAfricaAlbaniaArgentinaArmeniaAsiaAustraliaAustriaBahamasBangladeshBarbadosBelarusBelgiumBelizeBoliviaBosnia and HerzegovinaBrazilBulgariaBurma/MyanmarCabo VerdeCambodiaCameroonCanadaCaribbeanCentral AmericaChileChinaColombiaCongoCosta RicaCroatiaCubaCzechoslovakiaDenmarkDominicaDominican RepublicEastern AfricaEastern AsiaEastern EuropeEcuadorEgyptEl SalvadorEnglandEritreaEthiopiaEuropeFijiFranceGermanyGhanaGreeceGrenadaGuatemalaGuyanaHaitiHondurasHong KongHungaryIndiaIndonesiaIranIraqIrelandIsraelItalyJamaicaJapanJordanKazakhstanKenyaKoreaKuwaitLaosLatin AmericaLatviaLebanonLiberiaLithuaniaMalaysiaMexicoMicronesiaMiddle AfricaMoldovaMoroccoNepalNetherlandsNicaraguaNigeriaNorth AmericaNorth MacedoniaNorthern AfricaNorthern EuropeNorwayOceaniaPakistanPanamaPeruPhilippinesPolandPortugalRomaniaRussiaSaudi ArabiaScotlandSenegalSerbiaSierra LeoneSingaporeSomaliaSouth AfricaSouth AmericaSouth Central AsiaSouth Eastern AsiaSouthern EuropeSpainSri LankaSt. Vincent and the GrenadinesSudanSwedenSwitzerlandSyriaTaiwanThailandTrinidad and TobagoTurkeyUgandaUkraineUruguayUzbekistanVenezuelaVietnamWest IndiesWestern AfricaWestern AsiaWestern EuropeYemenZaireZimbabweAzores
Select to Compare
Race
Ancestry
AfghanAfricanAlaska NativeAlaskan AthabascanAlbanianAleutAlsatianAmericanApacheArabArapahoArgentineanArmenianAssyrian/Chaldean/SyriacAustralianAustrianBahamianBangladeshiBarbadianBasqueBelgianBelizeanBermudanBhutaneseBlackfeetBolivianBrazilianBritishBritish West IndianBulgarianBurmeseCajunCambodianCanadianCape VerdeanCarpatho RusynCelticCentral AmericanCentral American IndianCherokeeCheyenneChickasawChileanChineseChippewaChoctawColombianColvilleComancheCosta RicanCreeCreekCroatianCrowCubanCypriotCzechCzechoslovakianDanishDelawareDominicanDutchDutch West IndianEastern EuropeanEcuadorianEgyptianEnglishEstonianEthiopianEuropeanFijianFilipinoFinnishFrenchFrench American IndianFrench CanadianGermanGerman RussianGhanaianGreekGuamanian/ChamorroGuatemalanGuyaneseHaitianHmongHonduranHopiHoumaHungarianIcelanderIndian (Asian)IndonesianInupiatIranianIraqiIrishIroquoisIsraeliItalianJamaicanJapaneseJordanianKenyanKiowaKoreanLaotianLatvianLebaneseLiberianLithuanianLumbeeLuxembourgerMacedonianMalaysianMalteseMarshalleseMenomineeMexicanMexican American IndianMongolianMoroccanNative HawaiianNavajoNepaleseNew ZealanderNicaraguanNigerianNorthern EuropeanNorwegianOkinawanOsageOttawaPaiutePakistaniPalestinianPanamanianParaguayanPennsylvania GermanPeruvianPimaPolishPortuguesePotawatomiPuebloPuerto RicanPuget Sound SalishRomanianRussianSalvadoranSamoanScandinavianScotch-IrishScottishSeminoleSenegaleseSerbianShoshoneSierra LeoneanSiouxSlavicSlovakSloveneSomaliSouth AfricanSouth AmericanSouth American IndianSoviet UnionSpaniardSpanishSpanish AmericanSpanish American IndianSri LankanSubsaharan AfricanSudaneseSwedishSwissSyrianTaiwaneseThaiTlingit-HaidaTohono O'OdhamTonganTrinidadian and TobagonianTsimshianTurkishU.S. Virgin IslanderUgandanUkrainianUruguayanUteVenezuelanVietnameseWelshWest IndianYaquiYugoslavianYumanYup'ikZimbabwean
Immigration
NonimmigrantsImmigrantsAfghanistanAfricaAlbaniaArgentinaArmeniaAsiaAustraliaAustriaBahamasBangladeshBarbadosBelarusBelgiumBelizeBoliviaBosnia and HerzegovinaBrazilBulgariaBurma/MyanmarCabo VerdeCambodiaCameroonCanadaCaribbeanCentral AmericaChileChinaColombiaCongoCosta RicaCroatiaCubaCzechoslovakiaDenmarkDominicaDominican RepublicEastern AfricaEastern AsiaEastern EuropeEcuadorEgyptEl SalvadorEnglandEritreaEthiopiaEuropeFijiFranceGermanyGhanaGreeceGrenadaGuatemalaGuyanaHaitiHondurasHong KongHungaryIndiaIndonesiaIranIraqIrelandIsraelItalyJamaicaJapanJordanKazakhstanKenyaKoreaKuwaitLaosLatin AmericaLatviaLebanonLiberiaLithuaniaMalaysiaMexicoMicronesiaMiddle AfricaMoldovaMoroccoNepalNetherlandsNicaraguaNigeriaNorth AmericaNorth MacedoniaNorthern AfricaNorthern EuropeNorwayOceaniaPakistanPanamaPeruPhilippinesPolandPortugalRomaniaRussiaSaudi ArabiaScotlandSenegalSerbiaSierra LeoneSingaporeSomaliaSouth AfricaSouth AmericaSouth Central AsiaSouth Eastern AsiaSouthern EuropeSpainSri LankaSt. Vincent and the GrenadinesSudanSwedenSwitzerlandSyriaTaiwanThailandTrinidad and TobagoTurkeyUgandaUkraineUruguayUzbekistanVenezuelaVietnamWest IndiesWestern AfricaWestern AsiaWestern EuropeYemenZaireZimbabweAzores
Disability Age 5 to 17
Income
Poverty
Unemployment
Labor Participation
Family Structure
Vehicle Availability
Education Level
Disability

Yakama Disability Age 5 to 17
Tragic

6.3%
DISABILITY | AGE 5 TO 17
0.0/ 100
METRIC RATING
303rd/ 347
METRIC RANK

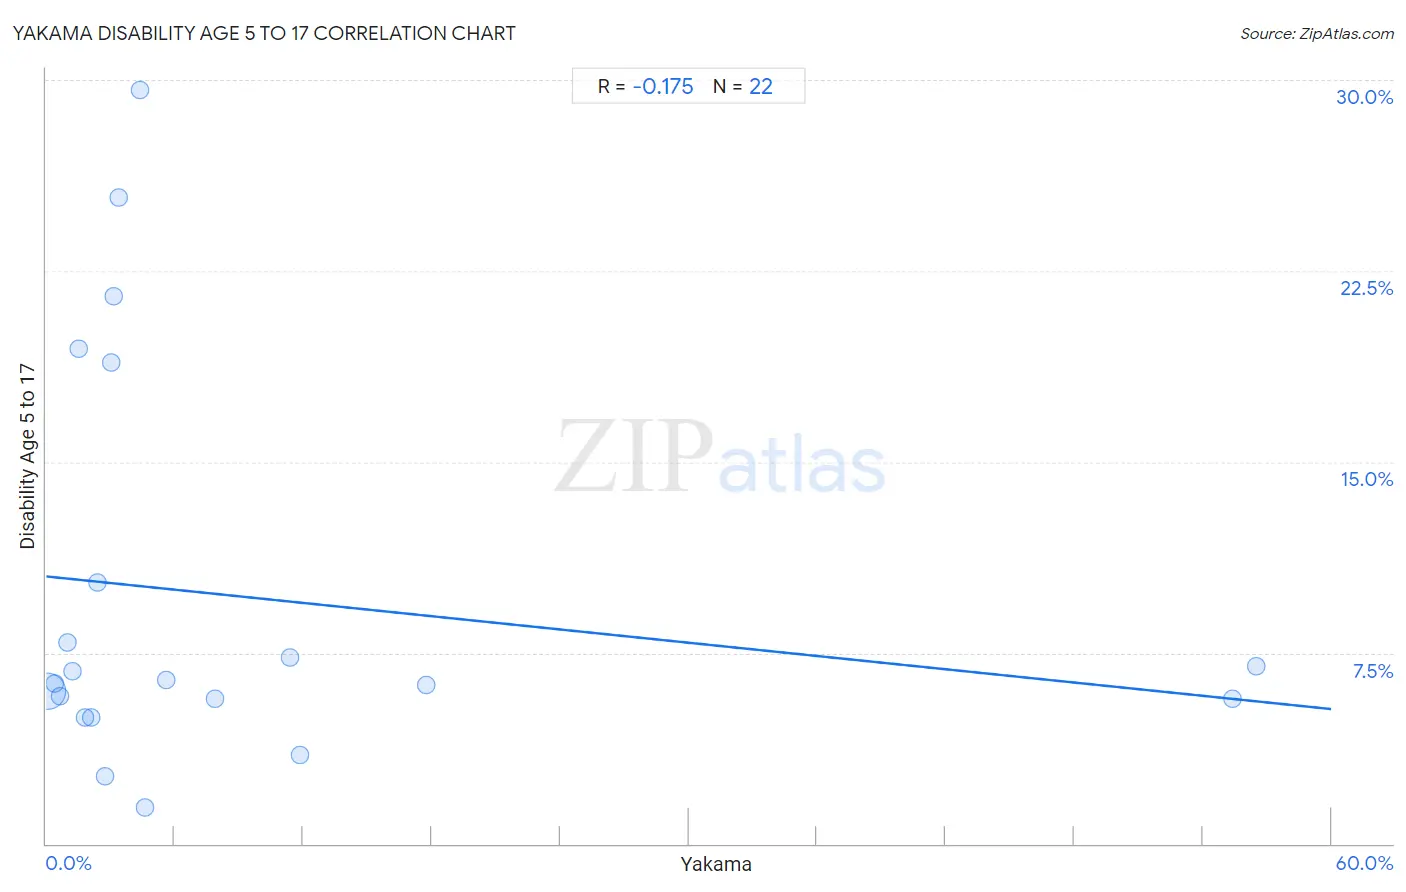
Yakama Disability Age 5 to 17 Correlation Chart

The statistical analysis conducted on geographies consisting of 19,874,624 people shows a poor negative correlation between the proportion of Yakama and percentage of population with a disability between the ages 5 and 17 in the United States with a correlation coefficient (R) of -0.175 and weighted average of 6.3%. On average, for every 1% (one percent) increase in Yakama within a typical geography, there is a decrease of 0.087% in percentage of population with a disability between the ages 5 and 17.
Yakama Disability Age 5 to 17
It is essential to understand that the correlation between the percentage of Yakama and percentage of population with a disability between the ages 5 and 17 does not imply a direct cause-and-effect relationship. It remains uncertain whether the presence of Yakama influences an upward or downward trend in the level of percentage of population with a disability between the ages 5 and 17 within an area, or if Yakama simply ended up residing in those areas with higher or lower levels of percentage of population with a disability between the ages 5 and 17 due to other factors.

Demographics Similar to Yakama by Disability Age 5 to 17

In terms of disability age 5 to 17, the demographic groups most similar to Yakama are Senegalese (6.3%, a difference of 0.080%), Celtic (6.3%, a difference of 0.10%), Native/Alaskan (6.3%, a difference of 0.22%), Nonimmigrants (6.3%, a difference of 0.32%), and U.S. Virgin Islander (6.3%, a difference of 0.43%).
DemographicsRating | RankDisability Age 5 to 17
Spanish Americans
0.0
/100
|
#296
Tragic
6.2%
Immigrants from Bahamas
0.0
/100
|
#297
Tragic
6.2%
Lumbee
0.0
/100
|
#298
Tragic
6.2%
Welsh
0.0
/100
|
#299
Tragic
6.3%
Carpatho Rusyns
0.0
/100
|
#300
Tragic
6.3%
U.S. Virgin Islanders
0.0
/100
|
#301
Tragic
6.3%
Celtics
0.0
/100
|
#302
Tragic
6.3%
Yakama
0.0
/100
|
#303
Tragic
6.3%
Senegalese
0.0
/100
|
#304
Tragic
6.3%
Natives/Alaskans
0.0
/100
|
#305
Tragic
6.3%
Nonimmigrants
0.0
/100
|
#306
Tragic
6.3%
Bahamians
0.0
/100
|
#307
Tragic
6.3%
Scotch-Irish
0.0
/100
|
#308
Tragic
6.3%
Hmong
0.0
/100
|
#309
Tragic
6.3%
Alaskan Athabascans
0.0
/100
|
#310
Tragic
6.3%

Yakama Disability Age 5 to 17 Correlation Summary

MeasurementYakama DataDisability Age 5 to 17 Data
Minimum0.033%1.4%
Maximum56.5%29.6%
Range56.5%28.2%
Mean9.0%9.7%
Median3.1%6.4%
Interquartile 25% (IQ1)1.5%5.7%
Interquartile 75% (IQ3)7.9%10.3%
Interquartile Range (IQR)6.4%4.6%
Standard Deviation (Sample)15.8%7.8%
Standard Deviation (Population)15.4%7.6%

Correlation Details

Yakama PercentileSample SizeDisability Age 5 to 17
[
0.0%
-
0.5%
]
0.033%
19,023,7026.0%
[
0.0%
-
0.5%
]
0.38%
565,7676.3%
[
0.5%
-
1.0%
]
0.66%
83,4105.8%
[
0.5%
-
1.0%
]
1.00%
68,9627.9%
[
1.0%
-
1.5%
]
1.22%
12,3676.8%
[
1.0%
-
1.5%
]
1.49%
5,97519.5%
[
1.5%
-
2.0%
]
1.79%
14,0064.9%
[
2.0%
-
2.5%
]
2.12%
43,0755.0%
[
2.0%
-
2.5%
]
2.42%
6,40510.3%
[
2.5%
-
3.0%
]
2.71%
1,7682.7%
[
3.0%
-
3.5%
]
3.03%
65918.9%
[
3.0%
-
3.5%
]
3.14%
2,67821.5%
[
3.0%
-
3.5%
]
3.40%
73625.4%
[
4.0%
-
4.5%
]
4.39%
56929.6%
[
4.5%
-
5.0%
]
4.60%
3,1531.4%
[
5.5%
-
6.0%
]
5.58%
11,1126.4%
[
7.5%
-
8.0%
]
7.88%
13,0155.7%
[
11.0%
-
11.5%
]
11.38%
1,1957.3%
[
11.5%
-
12.0%
]
11.87%
6403.5%
[
17.5%
-
18.0%
]
17.73%
13,1456.2%
[
55.0%
-
55.5%
]
55.39%
1,7245.7%
[
56.5%
-
57.0%
]
56.51%
5617.0%