Immigrants from Nepal Disability Age 5 to 17
COMPARE
Immigrants from Nepal
Select to Compare
Disability Age 5 to 17
Immigrants from Nepal Disability Age 5 to 17
5.5%
DISABILITY | AGE 5 TO 17
77.1/ 100
METRIC RATING
158th/ 347
METRIC RANK
Immigrants from Nepal Disability Age 5 to 17 Correlation Chart
The statistical analysis conducted on geographies consisting of 186,213,470 people shows no correlation between the proportion of Immigrants from Nepal and percentage of population with a disability between the ages 5 and 17 in the United States with a correlation coefficient (R) of 0.048 and weighted average of 5.5%. On average, for every 1% (one percent) increase in Immigrants from Nepal within a typical geography, there is an increase of 0.043% in percentage of population with a disability between the ages 5 and 17.
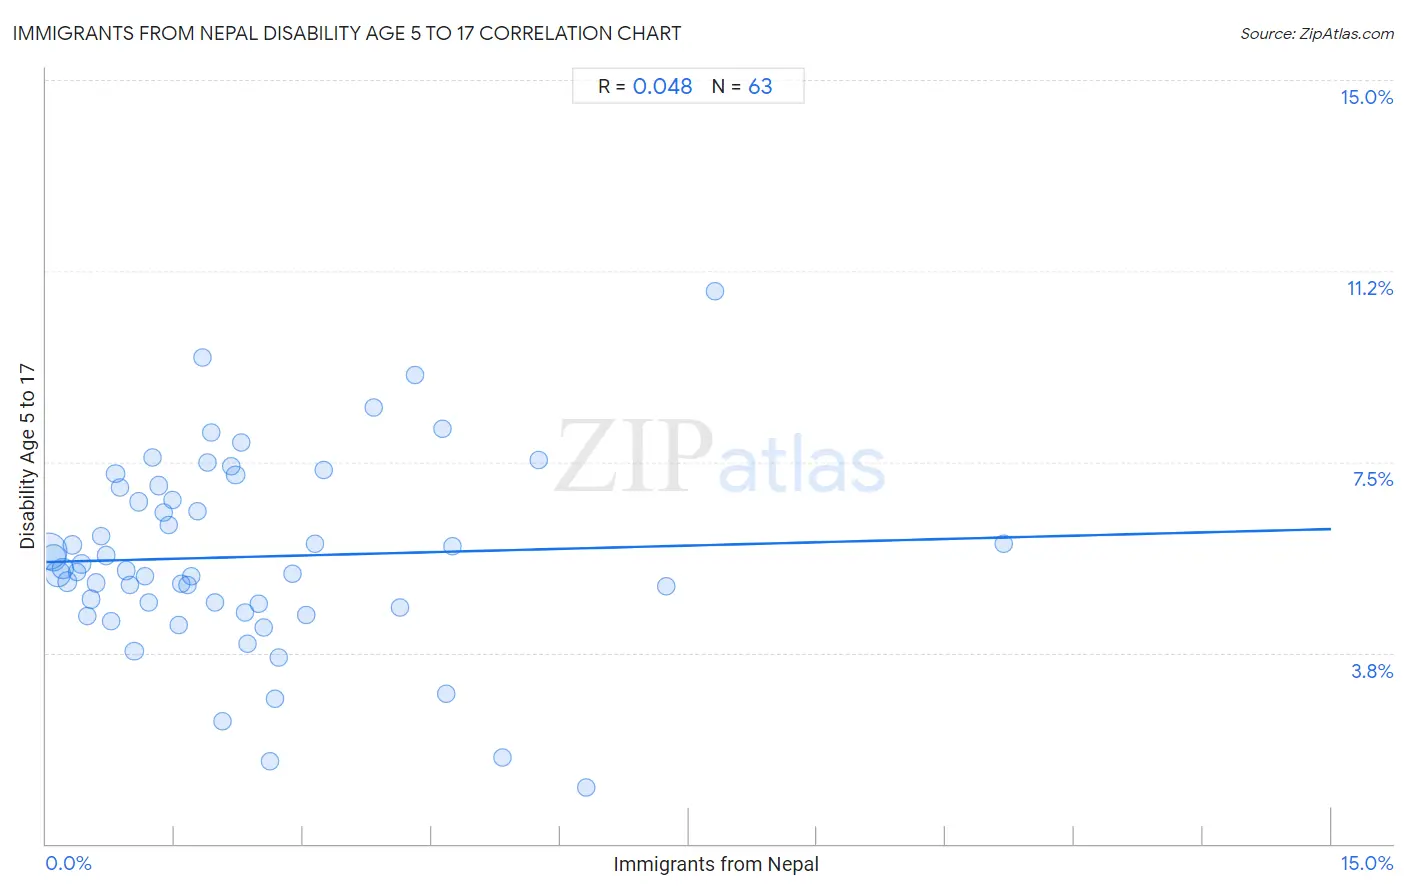
It is essential to understand that the correlation between the percentage of Immigrants from Nepal and percentage of population with a disability between the ages 5 and 17 does not imply a direct cause-and-effect relationship. It remains uncertain whether the presence of Immigrants from Nepal influences an upward or downward trend in the level of percentage of population with a disability between the ages 5 and 17 within an area, or if Immigrants from Nepal simply ended up residing in those areas with higher or lower levels of percentage of population with a disability between the ages 5 and 17 due to other factors.
Demographics Similar to Immigrants from Nepal by Disability Age 5 to 17
In terms of disability age 5 to 17, the demographic groups most similar to Immigrants from Nepal are Immigrants from Costa Rica (5.5%, a difference of 0.050%), Hawaiian (5.5%, a difference of 0.060%), Immigrants from Ecuador (5.5%, a difference of 0.080%), Australian (5.5%, a difference of 0.12%), and Immigrants from Zimbabwe (5.5%, a difference of 0.13%).
| Demographics | Rating | Rank | Disability Age 5 to 17 |
| Estonians | 80.8 /100 | #151 | Excellent 5.5% |
| Ute | 80.6 /100 | #152 | Excellent 5.5% |
| Ecuadorians | 79.7 /100 | #153 | Good 5.5% |
| Australians | 78.8 /100 | #154 | Good 5.5% |
| Immigrants from Ecuador | 78.3 /100 | #155 | Good 5.5% |
| Hawaiians | 78.0 /100 | #156 | Good 5.5% |
| Immigrants from Costa Rica | 77.9 /100 | #157 | Good 5.5% |
| Immigrants from Nepal | 77.1 /100 | #158 | Good 5.5% |
| Immigrants from Zimbabwe | 75.3 /100 | #159 | Good 5.5% |
| South Africans | 73.3 /100 | #160 | Good 5.5% |
| Immigrants from Saudi Arabia | 69.1 /100 | #161 | Good 5.5% |
| Zimbabweans | 67.2 /100 | #162 | Good 5.5% |
| Immigrants from Southern Europe | 64.0 /100 | #163 | Good 5.6% |
| Immigrants from Scotland | 61.9 /100 | #164 | Good 5.6% |
| Lebanese | 61.4 /100 | #165 | Good 5.6% |
Immigrants from Nepal Disability Age 5 to 17 Correlation Summary
| Measurement | Immigrants from Nepal Data | Disability Age 5 to 17 Data |
| Minimum | 0.026% | 1.1% |
| Maximum | 11.2% | 10.9% |
| Range | 11.2% | 9.7% |
| Mean | 2.3% | 5.6% |
| Median | 1.8% | 5.4% |
| Interquartile 25% (IQ1) | 0.87% | 4.6% |
| Interquartile 75% (IQ3) | 2.9% | 7.0% |
| Interquartile Range (IQR) | 2.0% | 2.4% |
| Standard Deviation (Sample) | 2.1% | 1.9% |
| Standard Deviation (Population) | 2.1% | 1.9% |
Correlation Details
| Immigrants from Nepal Percentile | Sample Size | Disability Age 5 to 17 |
[ 0.0% - 0.5% ] 0.026% | 77,620,277 | 5.7% |
[ 0.0% - 0.5% ] 0.080% | 34,233,859 | 5.6% |
[ 0.0% - 0.5% ] 0.14% | 28,095,851 | 5.3% |
[ 0.0% - 0.5% ] 0.19% | 12,208,987 | 5.4% |
[ 0.0% - 0.5% ] 0.25% | 6,853,762 | 5.1% |
[ 0.0% - 0.5% ] 0.30% | 6,057,757 | 5.9% |
[ 0.0% - 0.5% ] 0.36% | 3,876,123 | 5.3% |
[ 0.0% - 0.5% ] 0.41% | 3,310,410 | 5.5% |
[ 0.0% - 0.5% ] 0.48% | 1,854,692 | 4.5% |
[ 0.5% - 1.0% ] 0.52% | 1,612,199 | 4.8% |
[ 0.5% - 1.0% ] 0.58% | 1,482,572 | 5.1% |
[ 0.5% - 1.0% ] 0.64% | 1,094,353 | 6.0% |
[ 0.5% - 1.0% ] 0.70% | 1,039,057 | 5.7% |
[ 0.5% - 1.0% ] 0.75% | 979,898 | 4.4% |
[ 0.5% - 1.0% ] 0.81% | 807,043 | 7.3% |
[ 0.5% - 1.0% ] 0.87% | 232,880 | 7.0% |
[ 0.5% - 1.0% ] 0.93% | 368,715 | 5.4% |
[ 0.5% - 1.0% ] 0.98% | 444,474 | 5.1% |
[ 1.0% - 1.5% ] 1.03% | 412,434 | 3.8% |
[ 1.0% - 1.5% ] 1.08% | 621,003 | 6.7% |
[ 1.0% - 1.5% ] 1.15% | 332,401 | 5.3% |
[ 1.0% - 1.5% ] 1.20% | 196,945 | 4.7% |
[ 1.0% - 1.5% ] 1.24% | 169,187 | 7.6% |
[ 1.0% - 1.5% ] 1.32% | 190,462 | 7.0% |
[ 1.0% - 1.5% ] 1.37% | 140,052 | 6.5% |
[ 1.0% - 1.5% ] 1.42% | 68,691 | 6.3% |
[ 1.0% - 1.5% ] 1.48% | 27,554 | 6.8% |
[ 1.5% - 2.0% ] 1.54% | 76,641 | 4.3% |
[ 1.5% - 2.0% ] 1.58% | 46,945 | 5.1% |
[ 1.5% - 2.0% ] 1.65% | 178,897 | 5.1% |
[ 1.5% - 2.0% ] 1.70% | 100,652 | 5.3% |
[ 1.5% - 2.0% ] 1.76% | 107,656 | 6.5% |
[ 1.5% - 2.0% ] 1.83% | 20,634 | 9.5% |
[ 1.5% - 2.0% ] 1.88% | 91,390 | 7.5% |
[ 1.5% - 2.0% ] 1.93% | 24,975 | 8.1% |
[ 1.5% - 2.0% ] 1.96% | 356,781 | 4.8% |
[ 2.0% - 2.5% ] 2.05% | 2,437 | 2.4% |
[ 2.0% - 2.5% ] 2.16% | 54,548 | 7.4% |
[ 2.0% - 2.5% ] 2.21% | 109,029 | 7.2% |
[ 2.0% - 2.5% ] 2.28% | 26,531 | 7.9% |
[ 2.0% - 2.5% ] 2.32% | 28,055 | 4.6% |
[ 2.0% - 2.5% ] 2.35% | 43,568 | 3.9% |
[ 2.0% - 2.5% ] 2.48% | 12,802 | 4.7% |
[ 2.5% - 3.0% ] 2.54% | 54,526 | 4.3% |
[ 2.5% - 3.0% ] 2.61% | 8,194 | 1.6% |
[ 2.5% - 3.0% ] 2.66% | 51,967 | 2.8% |
[ 2.5% - 3.0% ] 2.72% | 108,870 | 3.7% |
[ 2.5% - 3.0% ] 2.87% | 17,107 | 5.3% |
[ 3.0% - 3.5% ] 3.04% | 115,734 | 4.5% |
[ 3.0% - 3.5% ] 3.13% | 38,632 | 5.9% |
[ 3.0% - 3.5% ] 3.24% | 11,364 | 7.3% |
[ 3.5% - 4.0% ] 3.82% | 32,951 | 8.6% |
[ 4.0% - 4.5% ] 4.13% | 16,761 | 4.6% |
[ 4.0% - 4.5% ] 4.30% | 26,684 | 9.2% |
[ 4.5% - 5.0% ] 4.62% | 6,861 | 8.1% |
[ 4.5% - 5.0% ] 4.67% | 26,483 | 2.9% |
[ 4.5% - 5.0% ] 4.75% | 14,553 | 5.8% |
[ 5.0% - 5.5% ] 5.32% | 1,936 | 1.7% |
[ 5.5% - 6.0% ] 5.75% | 6,571 | 7.5% |
[ 6.0% - 6.5% ] 6.30% | 3,190 | 1.1% |
[ 7.0% - 7.5% ] 7.24% | 24,892 | 5.1% |
[ 7.5% - 8.0% ] 7.81% | 32,559 | 10.9% |
[ 11.0% - 11.5% ] 11.18% | 456 | 5.9% |