Slovak Disability Age 5 to 17

COMPARE

Slovak
Race
Ancestry
AfghanAfricanAlaska NativeAlaskan AthabascanAlbanianAleutAlsatianAmericanApacheArabArapahoArgentineanArmenianAssyrian/Chaldean/SyriacAustralianAustrianBahamianBangladeshiBarbadianBasqueBelgianBelizeanBermudanBhutaneseBlackfeetBolivianBrazilianBritishBritish West IndianBulgarianBurmeseCajunCambodianCanadianCape VerdeanCarpatho RusynCelticCentral AmericanCentral American IndianCherokeeCheyenneChickasawChileanChineseChippewaChoctawColombianColvilleComancheCosta RicanCreeCreekCroatianCrowCubanCypriotCzechCzechoslovakianDanishDelawareDominicanDutchDutch West IndianEastern EuropeanEcuadorianEgyptianEnglishEstonianEthiopianEuropeanFijianFilipinoFinnishFrenchFrench American IndianFrench CanadianGermanGerman RussianGhanaianGreekGuamanian/ChamorroGuatemalanGuyaneseHaitianHmongHonduranHopiHoumaHungarianIcelanderIndian (Asian)IndonesianInupiatIranianIraqiIrishIroquoisIsraeliItalianJamaicanJapaneseJordanianKenyanKiowaKoreanLaotianLatvianLebaneseLiberianLithuanianLumbeeLuxembourgerMacedonianMalaysianMalteseMarshalleseMenomineeMexicanMexican American IndianMongolianMoroccanNative HawaiianNavajoNepaleseNew ZealanderNicaraguanNigerianNorthern EuropeanNorwegianOkinawanOsageOttawaPaiutePakistaniPalestinianPanamanianParaguayanPennsylvania GermanPeruvianPimaPolishPortuguesePotawatomiPuebloPuerto RicanPuget Sound SalishRomanianRussianSalvadoranSamoanScandinavianScotch-IrishScottishSeminoleSenegaleseSerbianShoshoneSierra LeoneanSiouxSlavicSlovakSloveneSomaliSouth AfricanSouth AmericanSouth American IndianSoviet UnionSpaniardSpanishSpanish AmericanSpanish American IndianSri LankanSubsaharan AfricanSudaneseSwedishSwissSyrianTaiwaneseThaiTlingit-HaidaTohono O'OdhamTonganTrinidadian and TobagonianTsimshianTurkishU.S. Virgin IslanderUgandanUkrainianUruguayanUteVenezuelanVietnameseWelshWest IndianYakamaYaquiYugoslavianYumanYup'ikZimbabwean
Immigration
NonimmigrantsImmigrantsAfghanistanAfricaAlbaniaArgentinaArmeniaAsiaAustraliaAustriaBahamasBangladeshBarbadosBelarusBelgiumBelizeBoliviaBosnia and HerzegovinaBrazilBulgariaBurma/MyanmarCabo VerdeCambodiaCameroonCanadaCaribbeanCentral AmericaChileChinaColombiaCongoCosta RicaCroatiaCubaCzechoslovakiaDenmarkDominicaDominican RepublicEastern AfricaEastern AsiaEastern EuropeEcuadorEgyptEl SalvadorEnglandEritreaEthiopiaEuropeFijiFranceGermanyGhanaGreeceGrenadaGuatemalaGuyanaHaitiHondurasHong KongHungaryIndiaIndonesiaIranIraqIrelandIsraelItalyJamaicaJapanJordanKazakhstanKenyaKoreaKuwaitLaosLatin AmericaLatviaLebanonLiberiaLithuaniaMalaysiaMexicoMicronesiaMiddle AfricaMoldovaMoroccoNepalNetherlandsNicaraguaNigeriaNorth AmericaNorth MacedoniaNorthern AfricaNorthern EuropeNorwayOceaniaPakistanPanamaPeruPhilippinesPolandPortugalRomaniaRussiaSaudi ArabiaScotlandSenegalSerbiaSierra LeoneSingaporeSomaliaSouth AfricaSouth AmericaSouth Central AsiaSouth Eastern AsiaSouthern EuropeSpainSri LankaSt. Vincent and the GrenadinesSudanSwedenSwitzerlandSyriaTaiwanThailandTrinidad and TobagoTurkeyUgandaUkraineUruguayUzbekistanVenezuelaVietnamWest IndiesWestern AfricaWestern AsiaWestern EuropeYemenZaireZimbabweAzores
Select to Compare
Race
Ancestry
AfghanAfricanAlaska NativeAlaskan AthabascanAlbanianAleutAlsatianAmericanApacheArabArapahoArgentineanArmenianAssyrian/Chaldean/SyriacAustralianAustrianBahamianBangladeshiBarbadianBasqueBelgianBelizeanBermudanBhutaneseBlackfeetBolivianBrazilianBritishBritish West IndianBulgarianBurmeseCajunCambodianCanadianCape VerdeanCarpatho RusynCelticCentral AmericanCentral American IndianCherokeeCheyenneChickasawChileanChineseChippewaChoctawColombianColvilleComancheCosta RicanCreeCreekCroatianCrowCubanCypriotCzechCzechoslovakianDanishDelawareDominicanDutchDutch West IndianEastern EuropeanEcuadorianEgyptianEnglishEstonianEthiopianEuropeanFijianFilipinoFinnishFrenchFrench American IndianFrench CanadianGermanGerman RussianGhanaianGreekGuamanian/ChamorroGuatemalanGuyaneseHaitianHmongHonduranHopiHoumaHungarianIcelanderIndian (Asian)IndonesianInupiatIranianIraqiIrishIroquoisIsraeliItalianJamaicanJapaneseJordanianKenyanKiowaKoreanLaotianLatvianLebaneseLiberianLithuanianLumbeeLuxembourgerMacedonianMalaysianMalteseMarshalleseMenomineeMexicanMexican American IndianMongolianMoroccanNative HawaiianNavajoNepaleseNew ZealanderNicaraguanNigerianNorthern EuropeanNorwegianOkinawanOsageOttawaPaiutePakistaniPalestinianPanamanianParaguayanPennsylvania GermanPeruvianPimaPolishPortuguesePotawatomiPuebloPuerto RicanPuget Sound SalishRomanianRussianSalvadoranSamoanScandinavianScotch-IrishScottishSeminoleSenegaleseSerbianShoshoneSierra LeoneanSiouxSlavicSloveneSomaliSouth AfricanSouth AmericanSouth American IndianSoviet UnionSpaniardSpanishSpanish AmericanSpanish American IndianSri LankanSubsaharan AfricanSudaneseSwedishSwissSyrianTaiwaneseThaiTlingit-HaidaTohono O'OdhamTonganTrinidadian and TobagonianTsimshianTurkishU.S. Virgin IslanderUgandanUkrainianUruguayanUteVenezuelanVietnameseWelshWest IndianYakamaYaquiYugoslavianYumanYup'ikZimbabwean
Immigration
NonimmigrantsImmigrantsAfghanistanAfricaAlbaniaArgentinaArmeniaAsiaAustraliaAustriaBahamasBangladeshBarbadosBelarusBelgiumBelizeBoliviaBosnia and HerzegovinaBrazilBulgariaBurma/MyanmarCabo VerdeCambodiaCameroonCanadaCaribbeanCentral AmericaChileChinaColombiaCongoCosta RicaCroatiaCubaCzechoslovakiaDenmarkDominicaDominican RepublicEastern AfricaEastern AsiaEastern EuropeEcuadorEgyptEl SalvadorEnglandEritreaEthiopiaEuropeFijiFranceGermanyGhanaGreeceGrenadaGuatemalaGuyanaHaitiHondurasHong KongHungaryIndiaIndonesiaIranIraqIrelandIsraelItalyJamaicaJapanJordanKazakhstanKenyaKoreaKuwaitLaosLatin AmericaLatviaLebanonLiberiaLithuaniaMalaysiaMexicoMicronesiaMiddle AfricaMoldovaMoroccoNepalNetherlandsNicaraguaNigeriaNorth AmericaNorth MacedoniaNorthern AfricaNorthern EuropeNorwayOceaniaPakistanPanamaPeruPhilippinesPolandPortugalRomaniaRussiaSaudi ArabiaScotlandSenegalSerbiaSierra LeoneSingaporeSomaliaSouth AfricaSouth AmericaSouth Central AsiaSouth Eastern AsiaSouthern EuropeSpainSri LankaSt. Vincent and the GrenadinesSudanSwedenSwitzerlandSyriaTaiwanThailandTrinidad and TobagoTurkeyUgandaUkraineUruguayUzbekistanVenezuelaVietnamWest IndiesWestern AfricaWestern AsiaWestern EuropeYemenZaireZimbabweAzores
Disability Age 5 to 17
Income
Poverty
Unemployment
Labor Participation
Family Structure
Vehicle Availability
Education Level
Disability

Slovak Disability Age 5 to 17
Tragic

6.5%
DISABILITY | AGE 5 TO 17
0.0/ 100
METRIC RATING
322nd/ 347
METRIC RANK

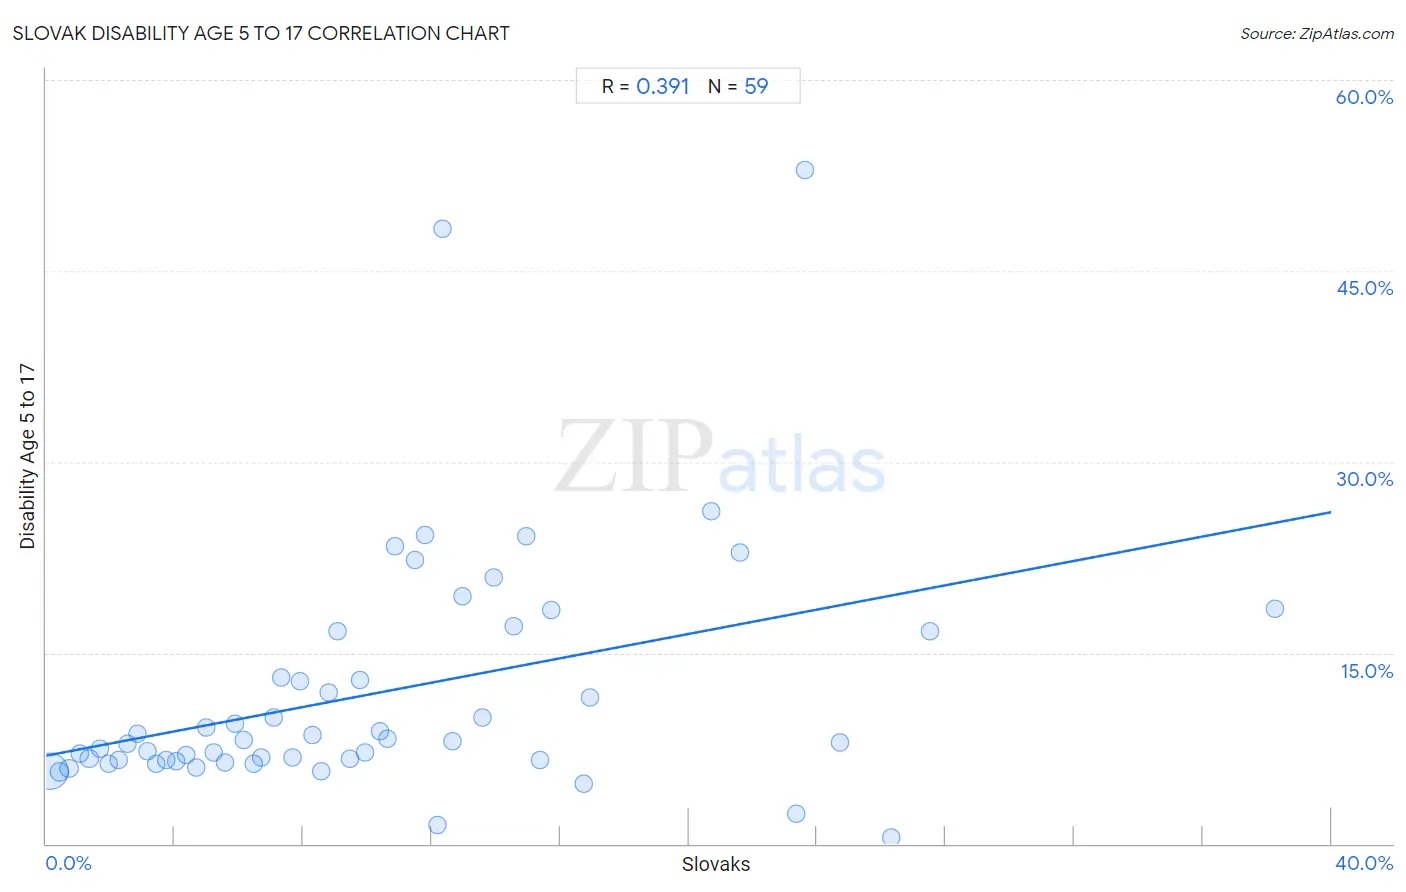
Slovak Disability Age 5 to 17 Correlation Chart

The statistical analysis conducted on geographies consisting of 393,379,089 people shows a mild positive correlation between the proportion of Slovaks and percentage of population with a disability between the ages 5 and 17 in the United States with a correlation coefficient (R) of 0.391 and weighted average of 6.5%. On average, for every 1% (one percent) increase in Slovaks within a typical geography, there is an increase of 0.48% in percentage of population with a disability between the ages 5 and 17.
Slovak Disability Age 5 to 17
It is essential to understand that the correlation between the percentage of Slovaks and percentage of population with a disability between the ages 5 and 17 does not imply a direct cause-and-effect relationship. It remains uncertain whether the presence of Slovaks influences an upward or downward trend in the level of percentage of population with a disability between the ages 5 and 17 within an area, or if Slovaks simply ended up residing in those areas with higher or lower levels of percentage of population with a disability between the ages 5 and 17 due to other factors.

Demographics Similar to Slovaks by Disability Age 5 to 17

In terms of disability age 5 to 17, the demographic groups most similar to Slovaks are Tohono O'odham (6.5%, a difference of 0.020%), Osage (6.5%, a difference of 0.040%), Dominican (6.5%, a difference of 0.12%), American (6.5%, a difference of 0.17%), and Potawatomi (6.5%, a difference of 0.31%).
DemographicsRating | RankDisability Age 5 to 17
Immigrants from Portugal
0.0
/100
|
#315
Tragic
6.4%
Immigrants from Dominican Republic
0.0
/100
|
#316
Tragic
6.4%
Kiowa
0.0
/100
|
#317
Tragic
6.4%
Comanche
0.0
/100
|
#318
Tragic
6.4%
Delaware
0.0
/100
|
#319
Tragic
6.5%
Africans
0.0
/100
|
#320
Tragic
6.5%
Tohono O'odham
0.0
/100
|
#321
Tragic
6.5%
Slovaks
0.0
/100
|
#322
Tragic
6.5%
Osage
0.0
/100
|
#323
Tragic
6.5%
Dominicans
0.0
/100
|
#324
Tragic
6.5%
Americans
0.0
/100
|
#325
Tragic
6.5%
Potawatomi
0.0
/100
|
#326
Tragic
6.5%
French American Indians
0.0
/100
|
#327
Tragic
6.6%
Pennsylvania Germans
0.0
/100
|
#328
Tragic
6.6%
Blackfeet
0.0
/100
|
#329
Tragic
6.6%

Slovak Disability Age 5 to 17 Correlation Summary

MeasurementSlovak DataDisability Age 5 to 17 Data
Minimum0.10%0.44%
Maximum38.3%52.9%
Range38.2%52.5%
Mean10.3%11.8%
Median8.8%8.1%
Interquartile 25% (IQ1)4.3%6.5%
Interquartile 75% (IQ3)13.9%16.7%
Interquartile Range (IQR)9.6%10.1%
Standard Deviation (Sample)7.8%9.6%
Standard Deviation (Population)7.8%9.5%

Correlation Details

Slovak PercentileSample SizeDisability Age 5 to 17
[
0.0%
-
0.5%
]
0.10%
320,612,6735.7%
[
0.0%
-
0.5%
]
0.41%
41,090,6545.6%
[
0.5%
-
1.0%
]
0.72%
12,141,1995.9%
[
1.0%
-
1.5%
]
1.04%
5,283,4077.0%
[
1.0%
-
1.5%
]
1.34%
2,966,1676.7%
[
1.5%
-
2.0%
]
1.66%
2,277,2557.5%
[
1.5%
-
2.0%
]
1.94%
1,472,3146.3%
[
2.0%
-
2.5%
]
2.27%
1,566,9986.6%
[
2.5%
-
3.0%
]
2.54%
815,4967.8%
[
2.5%
-
3.0%
]
2.85%
842,8698.7%
[
3.0%
-
3.5%
]
3.15%
659,4657.3%
[
3.0%
-
3.5%
]
3.43%
690,3936.3%
[
3.5%
-
4.0%
]
3.74%
462,1836.6%
[
4.0%
-
4.5%
]
4.05%
441,8356.5%
[
4.0%
-
4.5%
]
4.34%
308,8167.0%
[
4.5%
-
5.0%
]
4.66%
195,8196.0%
[
4.5%
-
5.0%
]
4.96%
243,0389.1%
[
5.0%
-
5.5%
]
5.20%
191,8067.2%
[
5.5%
-
6.0%
]
5.55%
96,2546.3%
[
5.5%
-
6.0%
]
5.87%
205,1679.5%
[
6.0%
-
6.5%
]
6.15%
110,5278.2%
[
6.0%
-
6.5%
]
6.47%
96,0076.3%
[
6.5%
-
7.0%
]
6.70%
160,4716.8%
[
7.0%
-
7.5%
]
7.10%
25,1389.9%
[
7.0%
-
7.5%
]
7.33%
33,78613.0%
[
7.5%
-
8.0%
]
7.65%
75,9586.8%
[
7.5%
-
8.0%
]
7.91%
29,63612.7%
[
8.0%
-
8.5%
]
8.29%
62,4508.5%
[
8.5%
-
9.0%
]
8.54%
49,1315.7%
[
8.5%
-
9.0%
]
8.80%
23,79611.9%
[
9.0%
-
9.5%
]
9.08%
6,39116.7%
[
9.0%
-
9.5%
]
9.47%
7,9716.7%
[
9.5%
-
10.0%
]
9.77%
38,35612.9%
[
9.5%
-
10.0%
]
9.93%
2,4167.2%
[
10.0%
-
10.5%
]
10.38%
2,4668.8%
[
10.5%
-
11.0%
]
10.61%
14,2278.2%
[
10.5%
-
11.0%
]
10.85%
2,86723.4%
[
11.0%
-
11.5%
]
11.46%
39,33122.3%
[
11.5%
-
12.0%
]
11.79%
1,59524.3%
[
12.0%
-
12.5%
]
12.18%
1,2321.5%
[
12.0%
-
12.5%
]
12.33%
29248.3%
[
12.5%
-
13.0%
]
12.64%
3,6018.1%
[
12.5%
-
13.0%
]
12.94%
6,68319.5%
[
13.5%
-
14.0%
]
13.60%
2,9649.9%
[
13.5%
-
14.0%
]
13.95%
1,77120.9%
[
14.5%
-
15.0%
]
14.55%
1,40217.1%
[
14.5%
-
15.0%
]
14.94%
3,15224.1%
[
15.0%
-
15.5%
]
15.38%
1,5476.5%
[
15.5%
-
16.0%
]
15.71%
62418.3%
[
16.5%
-
17.0%
]
16.72%
9994.8%
[
16.5%
-
17.0%
]
16.94%
3,34811.5%
[
20.5%
-
21.0%
]
20.71%
14026.1%
[
21.5%
-
22.0%
]
21.58%
50522.9%
[
23.0%
-
23.5%
]
23.35%
1,7302.4%
[
23.5%
-
24.0%
]
23.60%
16152.9%
[
24.5%
-
25.0%
]
24.71%
3488.0%
[
26.0%
-
26.5%
]
26.32%
1,3450.44%
[
27.0%
-
27.5%
]
27.50%
24016.7%
[
38.0%
-
38.5%
]
38.26%
67718.5%