Immigrants from Western Europe Disability Age 5 to 17

COMPARE

Immigrants from Western Europe
Race
Ancestry
AfghanAfricanAlaska NativeAlaskan AthabascanAlbanianAleutAlsatianAmericanApacheArabArapahoArgentineanArmenianAssyrian/Chaldean/SyriacAustralianAustrianBahamianBangladeshiBarbadianBasqueBelgianBelizeanBermudanBhutaneseBlackfeetBolivianBrazilianBritishBritish West IndianBulgarianBurmeseCajunCambodianCanadianCape VerdeanCarpatho RusynCelticCentral AmericanCentral American IndianCherokeeCheyenneChickasawChileanChineseChippewaChoctawColombianColvilleComancheCosta RicanCreeCreekCroatianCrowCubanCypriotCzechCzechoslovakianDanishDelawareDominicanDutchDutch West IndianEastern EuropeanEcuadorianEgyptianEnglishEstonianEthiopianEuropeanFijianFilipinoFinnishFrenchFrench American IndianFrench CanadianGermanGerman RussianGhanaianGreekGuamanian/ChamorroGuatemalanGuyaneseHaitianHmongHonduranHopiHoumaHungarianIcelanderIndian (Asian)IndonesianInupiatIranianIraqiIrishIroquoisIsraeliItalianJamaicanJapaneseJordanianKenyanKiowaKoreanLaotianLatvianLebaneseLiberianLithuanianLumbeeLuxembourgerMacedonianMalaysianMalteseMarshalleseMenomineeMexicanMexican American IndianMongolianMoroccanNative HawaiianNavajoNepaleseNew ZealanderNicaraguanNigerianNorthern EuropeanNorwegianOkinawanOsageOttawaPaiutePakistaniPalestinianPanamanianParaguayanPennsylvania GermanPeruvianPimaPolishPortuguesePotawatomiPuebloPuerto RicanPuget Sound SalishRomanianRussianSalvadoranSamoanScandinavianScotch-IrishScottishSeminoleSenegaleseSerbianShoshoneSierra LeoneanSiouxSlavicSlovakSloveneSomaliSouth AfricanSouth AmericanSouth American IndianSoviet UnionSpaniardSpanishSpanish AmericanSpanish American IndianSri LankanSubsaharan AfricanSudaneseSwedishSwissSyrianTaiwaneseThaiTlingit-HaidaTohono O'OdhamTonganTrinidadian and TobagonianTsimshianTurkishU.S. Virgin IslanderUgandanUkrainianUruguayanUteVenezuelanVietnameseWelshWest IndianYakamaYaquiYugoslavianYumanYup'ikZimbabwean
Immigration
NonimmigrantsImmigrantsAfghanistanAfricaAlbaniaArgentinaArmeniaAsiaAustraliaAustriaBahamasBangladeshBarbadosBelarusBelgiumBelizeBoliviaBosnia and HerzegovinaBrazilBulgariaBurma/MyanmarCabo VerdeCambodiaCameroonCanadaCaribbeanCentral AmericaChileChinaColombiaCongoCosta RicaCroatiaCubaCzechoslovakiaDenmarkDominicaDominican RepublicEastern AfricaEastern AsiaEastern EuropeEcuadorEgyptEl SalvadorEnglandEritreaEthiopiaEuropeFijiFranceGermanyGhanaGreeceGrenadaGuatemalaGuyanaHaitiHondurasHong KongHungaryIndiaIndonesiaIranIraqIrelandIsraelItalyJamaicaJapanJordanKazakhstanKenyaKoreaKuwaitLaosLatin AmericaLatviaLebanonLiberiaLithuaniaMalaysiaMexicoMicronesiaMiddle AfricaMoldovaMoroccoNepalNetherlandsNicaraguaNigeriaNorth AmericaNorth MacedoniaNorthern AfricaNorthern EuropeNorwayOceaniaPakistanPanamaPeruPhilippinesPolandPortugalRomaniaRussiaSaudi ArabiaScotlandSenegalSerbiaSierra LeoneSingaporeSomaliaSouth AfricaSouth AmericaSouth Central AsiaSouth Eastern AsiaSouthern EuropeSpainSri LankaSt. Vincent and the GrenadinesSudanSwedenSwitzerlandSyriaTaiwanThailandTrinidad and TobagoTurkeyUgandaUkraineUruguayUzbekistanVenezuelaVietnamWest IndiesWestern AfricaWestern AsiaWestern EuropeYemenZaireZimbabweAzores
Select to Compare
Race
Ancestry
AfghanAfricanAlaska NativeAlaskan AthabascanAlbanianAleutAlsatianAmericanApacheArabArapahoArgentineanArmenianAssyrian/Chaldean/SyriacAustralianAustrianBahamianBangladeshiBarbadianBasqueBelgianBelizeanBermudanBhutaneseBlackfeetBolivianBrazilianBritishBritish West IndianBulgarianBurmeseCajunCambodianCanadianCape VerdeanCarpatho RusynCelticCentral AmericanCentral American IndianCherokeeCheyenneChickasawChileanChineseChippewaChoctawColombianColvilleComancheCosta RicanCreeCreekCroatianCrowCubanCypriotCzechCzechoslovakianDanishDelawareDominicanDutchDutch West IndianEastern EuropeanEcuadorianEgyptianEnglishEstonianEthiopianEuropeanFijianFilipinoFinnishFrenchFrench American IndianFrench CanadianGermanGerman RussianGhanaianGreekGuamanian/ChamorroGuatemalanGuyaneseHaitianHmongHonduranHopiHoumaHungarianIcelanderIndian (Asian)IndonesianInupiatIranianIraqiIrishIroquoisIsraeliItalianJamaicanJapaneseJordanianKenyanKiowaKoreanLaotianLatvianLebaneseLiberianLithuanianLumbeeLuxembourgerMacedonianMalaysianMalteseMarshalleseMenomineeMexicanMexican American IndianMongolianMoroccanNative HawaiianNavajoNepaleseNew ZealanderNicaraguanNigerianNorthern EuropeanNorwegianOkinawanOsageOttawaPaiutePakistaniPalestinianPanamanianParaguayanPennsylvania GermanPeruvianPimaPolishPortuguesePotawatomiPuebloPuerto RicanPuget Sound SalishRomanianRussianSalvadoranSamoanScandinavianScotch-IrishScottishSeminoleSenegaleseSerbianShoshoneSierra LeoneanSiouxSlavicSlovakSloveneSomaliSouth AfricanSouth AmericanSouth American IndianSoviet UnionSpaniardSpanishSpanish AmericanSpanish American IndianSri LankanSubsaharan AfricanSudaneseSwedishSwissSyrianTaiwaneseThaiTlingit-HaidaTohono O'OdhamTonganTrinidadian and TobagonianTsimshianTurkishU.S. Virgin IslanderUgandanUkrainianUruguayanUteVenezuelanVietnameseWelshWest IndianYakamaYaquiYugoslavianYumanYup'ikZimbabwean
Immigration
NonimmigrantsImmigrantsAfghanistanAfricaAlbaniaArgentinaArmeniaAsiaAustraliaAustriaBahamasBangladeshBarbadosBelarusBelgiumBelizeBoliviaBosnia and HerzegovinaBrazilBulgariaBurma/MyanmarCabo VerdeCambodiaCameroonCanadaCaribbeanCentral AmericaChileChinaColombiaCongoCosta RicaCroatiaCubaCzechoslovakiaDenmarkDominicaDominican RepublicEastern AfricaEastern AsiaEastern EuropeEcuadorEgyptEl SalvadorEnglandEritreaEthiopiaEuropeFijiFranceGermanyGhanaGreeceGrenadaGuatemalaGuyanaHaitiHondurasHong KongHungaryIndiaIndonesiaIranIraqIrelandIsraelItalyJamaicaJapanJordanKazakhstanKenyaKoreaKuwaitLaosLatin AmericaLatviaLebanonLiberiaLithuaniaMalaysiaMexicoMicronesiaMiddle AfricaMoldovaMoroccoNepalNetherlandsNicaraguaNigeriaNorth AmericaNorth MacedoniaNorthern AfricaNorthern EuropeNorwayOceaniaPakistanPanamaPeruPhilippinesPolandPortugalRomaniaRussiaSaudi ArabiaScotlandSenegalSerbiaSierra LeoneSingaporeSomaliaSouth AfricaSouth AmericaSouth Central AsiaSouth Eastern AsiaSouthern EuropeSpainSri LankaSt. Vincent and the GrenadinesSudanSwedenSwitzerlandSyriaTaiwanThailandTrinidad and TobagoTurkeyUgandaUkraineUruguayUzbekistanVenezuelaVietnamWest IndiesWestern AfricaWestern AsiaYemenZaireZimbabweAzores
Disability Age 5 to 17
Income
Poverty
Unemployment
Labor Participation
Family Structure
Vehicle Availability
Education Level
Disability

Immigrants from Western Europe Disability Age 5 to 17
Average

5.6%
DISABILITY | AGE 5 TO 17
47.8/ 100
METRIC RATING
177th/ 347
METRIC RANK

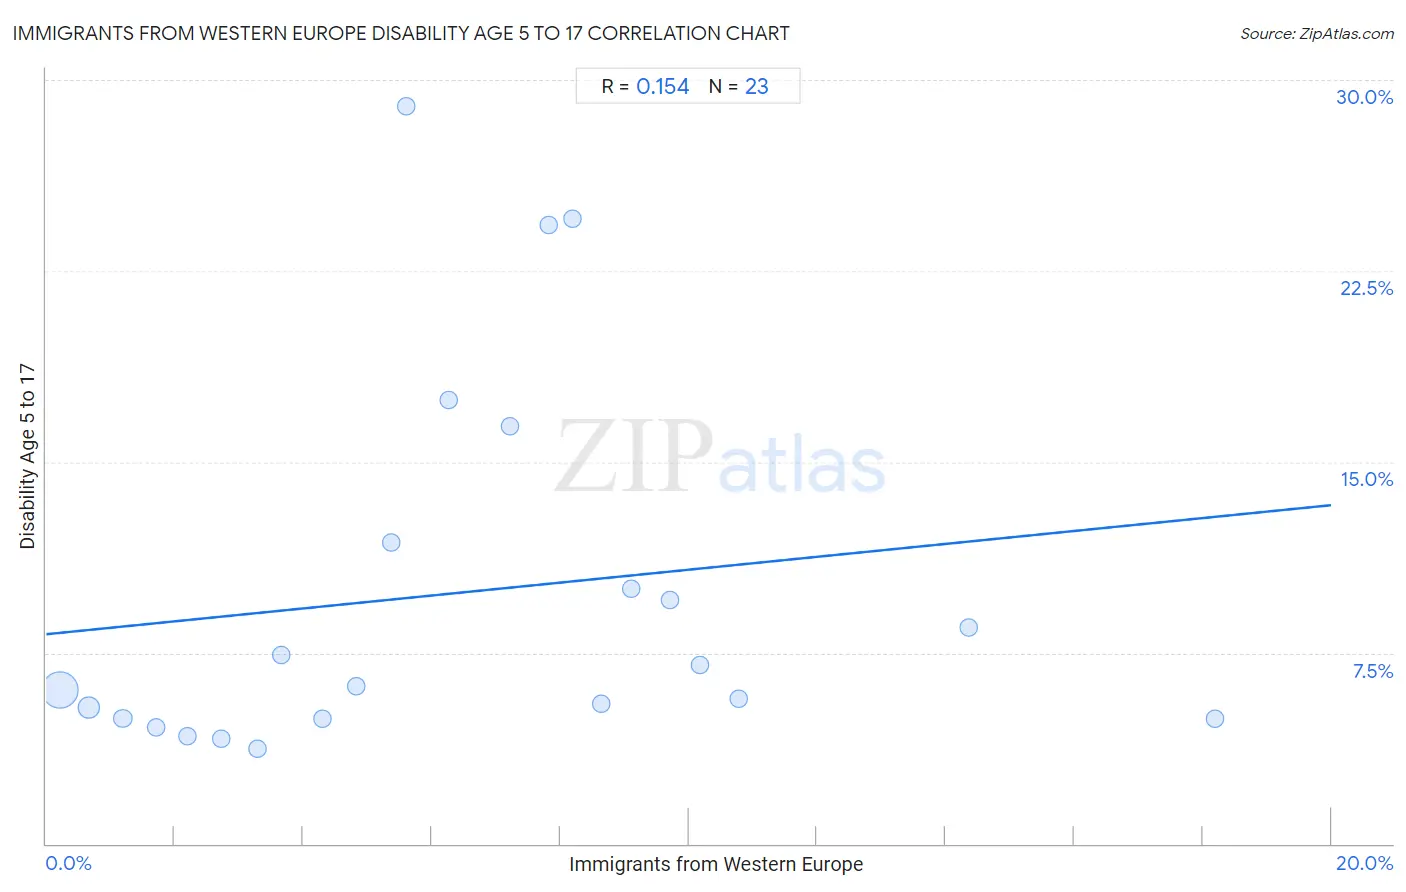
Immigrants from Western Europe Disability Age 5 to 17 Correlation Chart

The statistical analysis conducted on geographies consisting of 487,296,629 people shows a poor positive correlation between the proportion of Immigrants from Western Europe and percentage of population with a disability between the ages 5 and 17 in the United States with a correlation coefficient (R) of 0.154 and weighted average of 5.6%. On average, for every 1% (one percent) increase in Immigrants from Western Europe within a typical geography, there is an increase of 0.25% in percentage of population with a disability between the ages 5 and 17.
Immigrants from Western Europe Disability Age 5 to 17
It is essential to understand that the correlation between the percentage of Immigrants from Western Europe and percentage of population with a disability between the ages 5 and 17 does not imply a direct cause-and-effect relationship. It remains uncertain whether the presence of Immigrants from Western Europe influences an upward or downward trend in the level of percentage of population with a disability between the ages 5 and 17 within an area, or if Immigrants from Western Europe simply ended up residing in those areas with higher or lower levels of percentage of population with a disability between the ages 5 and 17 due to other factors.

Demographics Similar to Immigrants from Western Europe by Disability Age 5 to 17

In terms of disability age 5 to 17, the demographic groups most similar to Immigrants from Western Europe are Immigrants from Trinidad and Tobago (5.6%, a difference of 0.010%), Shoshone (5.6%, a difference of 0.080%), Immigrants from Central America (5.6%, a difference of 0.080%), Costa Rican (5.6%, a difference of 0.11%), and Uruguayan (5.6%, a difference of 0.16%).
DemographicsRating | RankDisability Age 5 to 17
Serbians
54.0
/100
|
#170
Average
5.6%
Immigrants from Iraq
53.9
/100
|
#171
Average
5.6%
Ukrainians
51.5
/100
|
#172
Average
5.6%
Uruguayans
51.0
/100
|
#173
Average
5.6%
Costa Ricans
50.0
/100
|
#174
Average
5.6%
Shoshone
49.4
/100
|
#175
Average
5.6%
Immigrants from Central America
49.4
/100
|
#176
Average
5.6%
Immigrants from Western Europe
47.8
/100
|
#177
Average
5.6%
Immigrants from Trinidad and Tobago
47.6
/100
|
#178
Average
5.6%
Immigrants from Barbados
40.5
/100
|
#179
Average
5.6%
Immigrants from Uruguay
37.7
/100
|
#180
Fair
5.6%
Immigrants from England
36.4
/100
|
#181
Fair
5.6%
Mexican American Indians
35.2
/100
|
#182
Fair
5.6%
Immigrants from Latin America
34.3
/100
|
#183
Fair
5.6%
Syrians
33.8
/100
|
#184
Fair
5.6%

Immigrants from Western Europe Disability Age 5 to 17 Correlation Summary

MeasurementImmigrants from Western Europe DataDisability Age 5 to 17 Data
Minimum0.21%3.7%
Maximum18.2%29.0%
Range18.0%25.2%
Mean6.4%9.8%
Median5.6%6.2%
Interquartile 25% (IQ1)2.7%4.9%
Interquartile 75% (IQ3)9.1%11.8%
Interquartile Range (IQR)6.4%6.9%
Standard Deviation (Sample)4.5%7.4%
Standard Deviation (Population)4.4%7.2%

Correlation Details

Immigrants from Western Europe PercentileSample SizeDisability Age 5 to 17
[
0.0%
-
0.5%
]
0.21%
392,681,5776.0%
[
0.5%
-
1.0%
]
0.66%
75,586,7405.3%
[
1.0%
-
1.5%
]
1.19%
12,476,6994.9%
[
1.5%
-
2.0%
]
1.71%
3,897,8994.6%
[
2.0%
-
2.5%
]
2.20%
1,789,2684.2%
[
2.5%
-
3.0%
]
2.73%
517,3734.1%
[
3.0%
-
3.5%
]
3.28%
142,9423.7%
[
3.5%
-
4.0%
]
3.66%
105,9087.4%
[
4.0%
-
4.5%
]
4.30%
41,7934.9%
[
4.5%
-
5.0%
]
4.83%
16,6106.2%
[
5.0%
-
5.5%
]
5.37%
16,92211.8%
[
5.5%
-
6.0%
]
5.60%
94729.0%
[
6.0%
-
6.5%
]
6.26%
2,33417.4%
[
7.0%
-
7.5%
]
7.22%
3,79616.4%
[
7.5%
-
8.0%
]
7.83%
5,17324.3%
[
8.0%
-
8.5%
]
8.18%
1,21024.6%
[
8.5%
-
9.0%
]
8.63%
4,3795.5%
[
9.0%
-
9.5%
]
9.10%
1,22010.0%
[
9.5%
-
10.0%
]
9.70%
1,6499.6%
[
10.0%
-
10.5%
]
10.18%
9637.0%
[
10.5%
-
11.0%
]
10.77%
1955.7%
[
14.0%
-
14.5%
]
14.36%
2028.5%
[
18.0%
-
18.5%
]
18.19%
8304.9%