Colombian Disability Age 5 to 17
COMPARE
Colombian
Select to Compare
Disability Age 5 to 17
Colombian Disability Age 5 to 17
5.5%
DISABILITY | AGE 5 TO 17
88.0/ 100
METRIC RATING
142nd/ 347
METRIC RANK
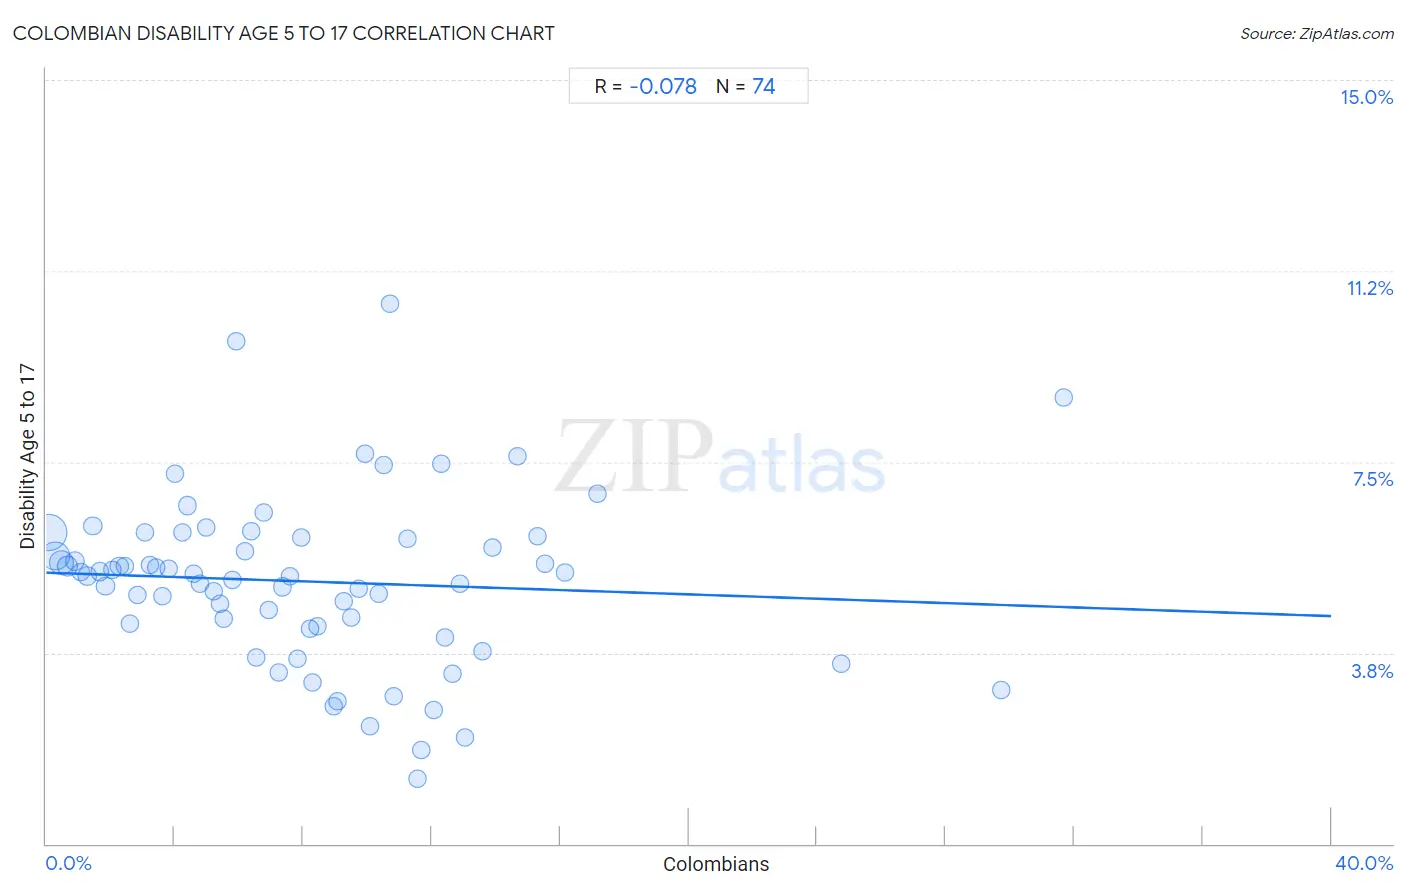
Colombian Disability Age 5 to 17 Correlation Chart
The statistical analysis conducted on geographies consisting of 416,048,287 people shows a slight negative correlation between the proportion of Colombians and percentage of population with a disability between the ages 5 and 17 in the United States with a correlation coefficient (R) of -0.078 and weighted average of 5.5%. On average, for every 1% (one percent) increase in Colombians within a typical geography, there is a decrease of 0.021% in percentage of population with a disability between the ages 5 and 17.
It is essential to understand that the correlation between the percentage of Colombians and percentage of population with a disability between the ages 5 and 17 does not imply a direct cause-and-effect relationship. It remains uncertain whether the presence of Colombians influences an upward or downward trend in the level of percentage of population with a disability between the ages 5 and 17 within an area, or if Colombians simply ended up residing in those areas with higher or lower levels of percentage of population with a disability between the ages 5 and 17 due to other factors.
Demographics Similar to Colombians by Disability Age 5 to 17
In terms of disability age 5 to 17, the demographic groups most similar to Colombians are Immigrants from Hungary (5.5%, a difference of 0.020%), Pakistani (5.5%, a difference of 0.090%), South American Indian (5.5%, a difference of 0.15%), Immigrants from Guatemala (5.5%, a difference of 0.16%), and Immigrants from Netherlands (5.4%, a difference of 0.32%).
| Demographics | Rating | Rank | Disability Age 5 to 17 |
| Immigrants from Belize | 91.7 /100 | #135 | Exceptional 5.4% |
| Immigrants from Denmark | 91.4 /100 | #136 | Exceptional 5.4% |
| Navajo | 90.9 /100 | #137 | Exceptional 5.4% |
| Immigrants from Oceania | 90.8 /100 | #138 | Exceptional 5.4% |
| Belizeans | 90.8 /100 | #139 | Exceptional 5.4% |
| Immigrants from Netherlands | 90.5 /100 | #140 | Exceptional 5.4% |
| South American Indians | 89.3 /100 | #141 | Excellent 5.5% |
| Colombians | 88.0 /100 | #142 | Excellent 5.5% |
| Immigrants from Hungary | 87.9 /100 | #143 | Excellent 5.5% |
| Pakistanis | 87.3 /100 | #144 | Excellent 5.5% |
| Immigrants from Guatemala | 86.6 /100 | #145 | Excellent 5.5% |
| Albanians | 83.7 /100 | #146 | Excellent 5.5% |
| Immigrants from Albania | 83.1 /100 | #147 | Excellent 5.5% |
| Samoans | 81.9 /100 | #148 | Excellent 5.5% |
| Central Americans | 81.6 /100 | #149 | Excellent 5.5% |
Colombian Disability Age 5 to 17 Correlation Summary
| Measurement | Colombian Data | Disability Age 5 to 17 Data |
| Minimum | 0.096% | 1.3% |
| Maximum | 31.7% | 10.6% |
| Range | 31.6% | 9.3% |
| Mean | 8.1% | 5.2% |
| Median | 7.3% | 5.3% |
| Interquartile 25% (IQ1) | 3.6% | 4.3% |
| Interquartile 75% (IQ3) | 11.2% | 6.0% |
| Interquartile Range (IQR) | 7.6% | 1.7% |
| Standard Deviation (Sample) | 6.2% | 1.7% |
| Standard Deviation (Population) | 6.1% | 1.7% |
Correlation Details
| Colombian Percentile | Sample Size | Disability Age 5 to 17 |
[ 0.0% - 0.5% ] 0.096% | 169,677,504 | 6.1% |
[ 0.0% - 0.5% ] 0.28% | 96,903,616 | 5.7% |
[ 0.0% - 0.5% ] 0.47% | 52,953,969 | 5.5% |
[ 0.5% - 1.0% ] 0.67% | 24,193,835 | 5.5% |
[ 0.5% - 1.0% ] 0.88% | 13,175,908 | 5.5% |
[ 1.0% - 1.5% ] 1.07% | 8,345,076 | 5.3% |
[ 1.0% - 1.5% ] 1.27% | 15,025,691 | 5.3% |
[ 1.0% - 1.5% ] 1.46% | 5,819,367 | 6.2% |
[ 1.5% - 2.0% ] 1.66% | 3,943,497 | 5.3% |
[ 1.5% - 2.0% ] 1.85% | 2,454,013 | 5.1% |
[ 2.0% - 2.5% ] 2.05% | 2,403,704 | 5.4% |
[ 2.0% - 2.5% ] 2.27% | 1,650,477 | 5.4% |
[ 2.0% - 2.5% ] 2.46% | 1,693,877 | 5.4% |
[ 2.5% - 3.0% ] 2.62% | 1,754,046 | 4.3% |
[ 2.5% - 3.0% ] 2.83% | 1,113,770 | 4.9% |
[ 3.0% - 3.5% ] 3.07% | 1,371,302 | 6.1% |
[ 3.0% - 3.5% ] 3.25% | 637,759 | 5.5% |
[ 3.0% - 3.5% ] 3.42% | 913,889 | 5.4% |
[ 3.5% - 4.0% ] 3.63% | 1,010,886 | 4.9% |
[ 3.5% - 4.0% ] 3.81% | 756,182 | 5.4% |
[ 3.5% - 4.0% ] 4.00% | 712,438 | 7.3% |
[ 4.0% - 4.5% ] 4.24% | 1,245,151 | 6.1% |
[ 4.0% - 4.5% ] 4.40% | 634,783 | 6.6% |
[ 4.5% - 5.0% ] 4.58% | 573,349 | 5.3% |
[ 4.5% - 5.0% ] 4.78% | 416,963 | 5.1% |
[ 4.5% - 5.0% ] 4.99% | 417,754 | 6.2% |
[ 5.0% - 5.5% ] 5.20% | 545,688 | 5.0% |
[ 5.0% - 5.5% ] 5.41% | 424,020 | 4.7% |
[ 5.5% - 6.0% ] 5.54% | 315,102 | 4.4% |
[ 5.5% - 6.0% ] 5.79% | 312,976 | 5.2% |
[ 5.5% - 6.0% ] 5.91% | 84,421 | 9.9% |
[ 6.0% - 6.5% ] 6.18% | 390,783 | 5.7% |
[ 6.0% - 6.5% ] 6.38% | 495,903 | 6.1% |
[ 6.5% - 7.0% ] 6.54% | 364,058 | 3.6% |
[ 6.5% - 7.0% ] 6.76% | 331,123 | 6.5% |
[ 6.5% - 7.0% ] 6.94% | 174,654 | 4.6% |
[ 7.0% - 7.5% ] 7.23% | 88,611 | 3.4% |
[ 7.0% - 7.5% ] 7.35% | 446,145 | 5.0% |
[ 7.5% - 8.0% ] 7.58% | 77,985 | 5.3% |
[ 7.5% - 8.0% ] 7.81% | 72,650 | 3.6% |
[ 7.5% - 8.0% ] 7.94% | 139,066 | 6.0% |
[ 8.0% - 8.5% ] 8.21% | 135,918 | 4.2% |
[ 8.0% - 8.5% ] 8.27% | 71,868 | 3.2% |
[ 8.0% - 8.5% ] 8.45% | 59,809 | 4.3% |
[ 8.5% - 9.0% ] 8.95% | 132,635 | 2.7% |
[ 9.0% - 9.5% ] 9.05% | 54,187 | 2.8% |
[ 9.0% - 9.5% ] 9.25% | 69,632 | 4.8% |
[ 9.5% - 10.0% ] 9.50% | 11,240 | 4.5% |
[ 9.5% - 10.0% ] 9.73% | 130,920 | 5.0% |
[ 9.5% - 10.0% ] 9.94% | 32,881 | 7.7% |
[ 10.0% - 10.5% ] 10.06% | 75,659 | 2.3% |
[ 10.0% - 10.5% ] 10.36% | 167,404 | 4.9% |
[ 10.0% - 10.5% ] 10.49% | 67,617 | 7.5% |
[ 10.5% - 11.0% ] 10.70% | 121,169 | 10.6% |
[ 10.5% - 11.0% ] 10.81% | 73,203 | 2.9% |
[ 11.0% - 11.5% ] 11.23% | 69,599 | 6.0% |
[ 11.5% - 12.0% ] 11.55% | 42,058 | 1.3% |
[ 11.5% - 12.0% ] 11.68% | 8,024 | 1.8% |
[ 12.0% - 12.5% ] 12.07% | 149,116 | 2.6% |
[ 12.0% - 12.5% ] 12.30% | 45,357 | 7.5% |
[ 12.0% - 12.5% ] 12.41% | 95,933 | 4.1% |
[ 12.5% - 13.0% ] 12.65% | 50,975 | 3.3% |
[ 12.5% - 13.0% ] 12.87% | 117,241 | 5.1% |
[ 13.0% - 13.5% ] 13.05% | 19,625 | 2.1% |
[ 13.5% - 14.0% ] 13.58% | 31,514 | 3.8% |
[ 13.5% - 14.0% ] 13.88% | 26,548 | 5.8% |
[ 14.5% - 15.0% ] 14.68% | 42,207 | 7.6% |
[ 15.0% - 15.5% ] 15.30% | 18,426 | 6.0% |
[ 15.5% - 16.0% ] 15.53% | 42,678 | 5.5% |
[ 16.0% - 16.5% ] 16.14% | 11,069 | 5.3% |
[ 17.0% - 17.5% ] 17.15% | 1,026 | 6.9% |
[ 24.5% - 25.0% ] 24.77% | 6,186 | 3.5% |
[ 29.5% - 30.0% ] 29.74% | 2,811 | 3.0% |
[ 31.5% - 32.0% ] 31.69% | 1,761 | 8.8% |