Shoshone Disability Age 5 to 17

COMPARE

Shoshone
Race
Ancestry
AfghanAfricanAlaska NativeAlaskan AthabascanAlbanianAleutAlsatianAmericanApacheArabArapahoArgentineanArmenianAssyrian/Chaldean/SyriacAustralianAustrianBahamianBangladeshiBarbadianBasqueBelgianBelizeanBermudanBhutaneseBlackfeetBolivianBrazilianBritishBritish West IndianBulgarianBurmeseCajunCambodianCanadianCape VerdeanCarpatho RusynCelticCentral AmericanCentral American IndianCherokeeCheyenneChickasawChileanChineseChippewaChoctawColombianColvilleComancheCosta RicanCreeCreekCroatianCrowCubanCypriotCzechCzechoslovakianDanishDelawareDominicanDutchDutch West IndianEastern EuropeanEcuadorianEgyptianEnglishEstonianEthiopianEuropeanFijianFilipinoFinnishFrenchFrench American IndianFrench CanadianGermanGerman RussianGhanaianGreekGuamanian/ChamorroGuatemalanGuyaneseHaitianHmongHonduranHopiHoumaHungarianIcelanderIndian (Asian)IndonesianInupiatIranianIraqiIrishIroquoisIsraeliItalianJamaicanJapaneseJordanianKenyanKiowaKoreanLaotianLatvianLebaneseLiberianLithuanianLumbeeLuxembourgerMacedonianMalaysianMalteseMarshalleseMenomineeMexicanMexican American IndianMongolianMoroccanNative HawaiianNavajoNepaleseNew ZealanderNicaraguanNigerianNorthern EuropeanNorwegianOkinawanOsageOttawaPaiutePakistaniPalestinianPanamanianParaguayanPennsylvania GermanPeruvianPimaPolishPortuguesePotawatomiPuebloPuerto RicanPuget Sound SalishRomanianRussianSalvadoranSamoanScandinavianScotch-IrishScottishSeminoleSenegaleseSerbianShoshoneSierra LeoneanSiouxSlavicSlovakSloveneSomaliSouth AfricanSouth AmericanSouth American IndianSoviet UnionSpaniardSpanishSpanish AmericanSpanish American IndianSri LankanSubsaharan AfricanSudaneseSwedishSwissSyrianTaiwaneseThaiTlingit-HaidaTohono O'OdhamTonganTrinidadian and TobagonianTsimshianTurkishU.S. Virgin IslanderUgandanUkrainianUruguayanUteVenezuelanVietnameseWelshWest IndianYakamaYaquiYugoslavianYumanYup'ikZimbabwean
Immigration
NonimmigrantsImmigrantsAfghanistanAfricaAlbaniaArgentinaArmeniaAsiaAustraliaAustriaBahamasBangladeshBarbadosBelarusBelgiumBelizeBoliviaBosnia and HerzegovinaBrazilBulgariaBurma/MyanmarCabo VerdeCambodiaCameroonCanadaCaribbeanCentral AmericaChileChinaColombiaCongoCosta RicaCroatiaCubaCzechoslovakiaDenmarkDominicaDominican RepublicEastern AfricaEastern AsiaEastern EuropeEcuadorEgyptEl SalvadorEnglandEritreaEthiopiaEuropeFijiFranceGermanyGhanaGreeceGrenadaGuatemalaGuyanaHaitiHondurasHong KongHungaryIndiaIndonesiaIranIraqIrelandIsraelItalyJamaicaJapanJordanKazakhstanKenyaKoreaKuwaitLaosLatin AmericaLatviaLebanonLiberiaLithuaniaMalaysiaMexicoMicronesiaMiddle AfricaMoldovaMoroccoNepalNetherlandsNicaraguaNigeriaNorth AmericaNorth MacedoniaNorthern AfricaNorthern EuropeNorwayOceaniaPakistanPanamaPeruPhilippinesPolandPortugalRomaniaRussiaSaudi ArabiaScotlandSenegalSerbiaSierra LeoneSingaporeSomaliaSouth AfricaSouth AmericaSouth Central AsiaSouth Eastern AsiaSouthern EuropeSpainSri LankaSt. Vincent and the GrenadinesSudanSwedenSwitzerlandSyriaTaiwanThailandTrinidad and TobagoTurkeyUgandaUkraineUruguayUzbekistanVenezuelaVietnamWest IndiesWestern AfricaWestern AsiaWestern EuropeYemenZaireZimbabweAzores
Select to Compare
Race
Ancestry
AfghanAfricanAlaska NativeAlaskan AthabascanAlbanianAleutAlsatianAmericanApacheArabArapahoArgentineanArmenianAssyrian/Chaldean/SyriacAustralianAustrianBahamianBangladeshiBarbadianBasqueBelgianBelizeanBermudanBhutaneseBlackfeetBolivianBrazilianBritishBritish West IndianBulgarianBurmeseCajunCambodianCanadianCape VerdeanCarpatho RusynCelticCentral AmericanCentral American IndianCherokeeCheyenneChickasawChileanChineseChippewaChoctawColombianColvilleComancheCosta RicanCreeCreekCroatianCrowCubanCypriotCzechCzechoslovakianDanishDelawareDominicanDutchDutch West IndianEastern EuropeanEcuadorianEgyptianEnglishEstonianEthiopianEuropeanFijianFilipinoFinnishFrenchFrench American IndianFrench CanadianGermanGerman RussianGhanaianGreekGuamanian/ChamorroGuatemalanGuyaneseHaitianHmongHonduranHopiHoumaHungarianIcelanderIndian (Asian)IndonesianInupiatIranianIraqiIrishIroquoisIsraeliItalianJamaicanJapaneseJordanianKenyanKiowaKoreanLaotianLatvianLebaneseLiberianLithuanianLumbeeLuxembourgerMacedonianMalaysianMalteseMarshalleseMenomineeMexicanMexican American IndianMongolianMoroccanNative HawaiianNavajoNepaleseNew ZealanderNicaraguanNigerianNorthern EuropeanNorwegianOkinawanOsageOttawaPaiutePakistaniPalestinianPanamanianParaguayanPennsylvania GermanPeruvianPimaPolishPortuguesePotawatomiPuebloPuerto RicanPuget Sound SalishRomanianRussianSalvadoranSamoanScandinavianScotch-IrishScottishSeminoleSenegaleseSerbianSierra LeoneanSiouxSlavicSlovakSloveneSomaliSouth AfricanSouth AmericanSouth American IndianSoviet UnionSpaniardSpanishSpanish AmericanSpanish American IndianSri LankanSubsaharan AfricanSudaneseSwedishSwissSyrianTaiwaneseThaiTlingit-HaidaTohono O'OdhamTonganTrinidadian and TobagonianTsimshianTurkishU.S. Virgin IslanderUgandanUkrainianUruguayanUteVenezuelanVietnameseWelshWest IndianYakamaYaquiYugoslavianYumanYup'ikZimbabwean
Immigration
NonimmigrantsImmigrantsAfghanistanAfricaAlbaniaArgentinaArmeniaAsiaAustraliaAustriaBahamasBangladeshBarbadosBelarusBelgiumBelizeBoliviaBosnia and HerzegovinaBrazilBulgariaBurma/MyanmarCabo VerdeCambodiaCameroonCanadaCaribbeanCentral AmericaChileChinaColombiaCongoCosta RicaCroatiaCubaCzechoslovakiaDenmarkDominicaDominican RepublicEastern AfricaEastern AsiaEastern EuropeEcuadorEgyptEl SalvadorEnglandEritreaEthiopiaEuropeFijiFranceGermanyGhanaGreeceGrenadaGuatemalaGuyanaHaitiHondurasHong KongHungaryIndiaIndonesiaIranIraqIrelandIsraelItalyJamaicaJapanJordanKazakhstanKenyaKoreaKuwaitLaosLatin AmericaLatviaLebanonLiberiaLithuaniaMalaysiaMexicoMicronesiaMiddle AfricaMoldovaMoroccoNepalNetherlandsNicaraguaNigeriaNorth AmericaNorth MacedoniaNorthern AfricaNorthern EuropeNorwayOceaniaPakistanPanamaPeruPhilippinesPolandPortugalRomaniaRussiaSaudi ArabiaScotlandSenegalSerbiaSierra LeoneSingaporeSomaliaSouth AfricaSouth AmericaSouth Central AsiaSouth Eastern AsiaSouthern EuropeSpainSri LankaSt. Vincent and the GrenadinesSudanSwedenSwitzerlandSyriaTaiwanThailandTrinidad and TobagoTurkeyUgandaUkraineUruguayUzbekistanVenezuelaVietnamWest IndiesWestern AfricaWestern AsiaWestern EuropeYemenZaireZimbabweAzores
Disability Age 5 to 17
Income
Poverty
Unemployment
Labor Participation
Family Structure
Vehicle Availability
Education Level
Disability

Shoshone Disability Age 5 to 17
Average

5.6%
DISABILITY | AGE 5 TO 17
49.4/ 100
METRIC RATING
175th/ 347
METRIC RANK

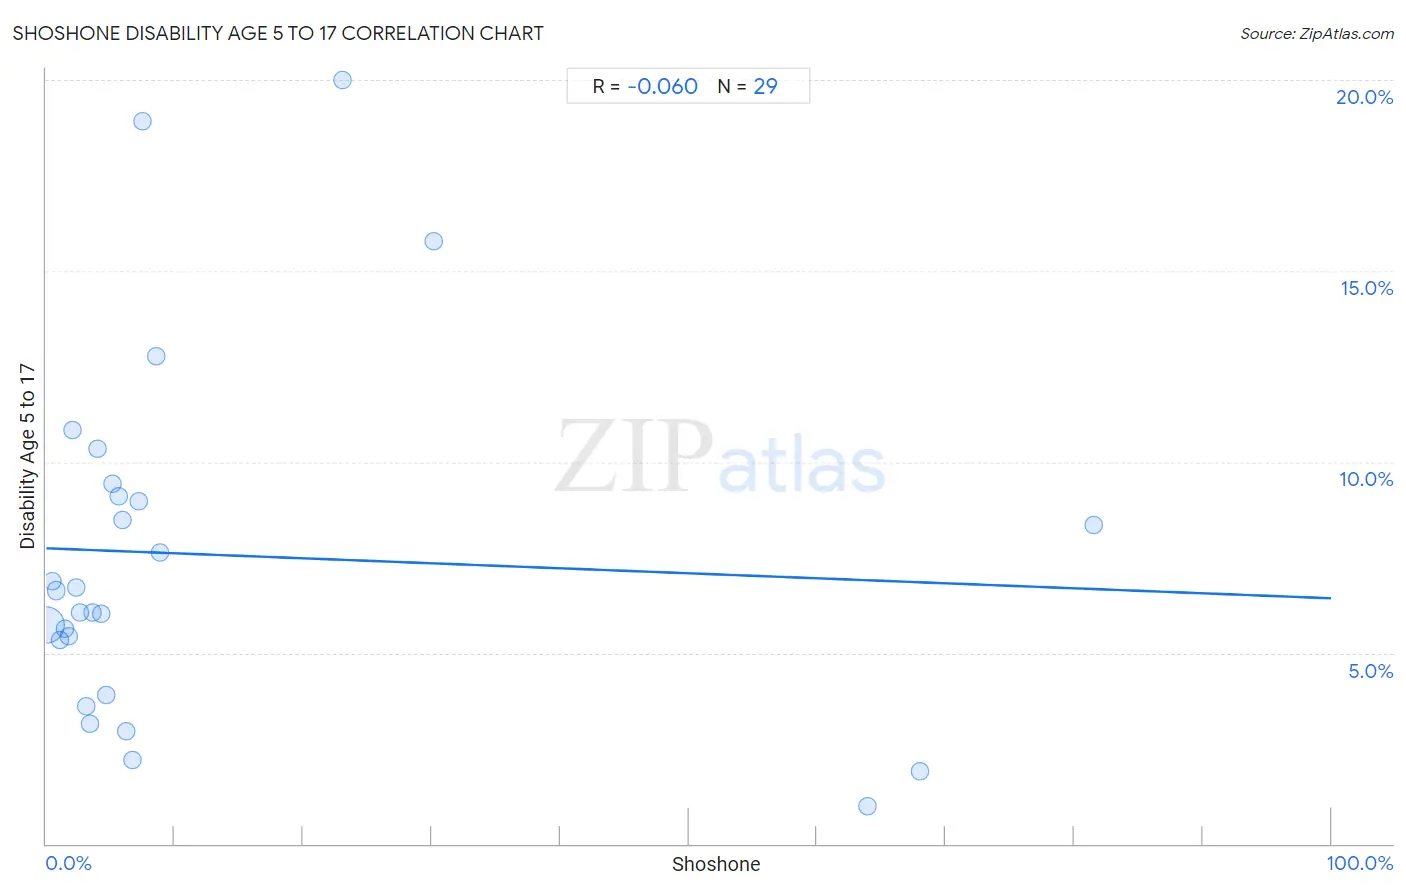
Shoshone Disability Age 5 to 17 Correlation Chart

The statistical analysis conducted on geographies consisting of 66,499,721 people shows a slight negative correlation between the proportion of Shoshone and percentage of population with a disability between the ages 5 and 17 in the United States with a correlation coefficient (R) of -0.060 and weighted average of 5.6%. On average, for every 1% (one percent) increase in Shoshone within a typical geography, there is a decrease of 0.013% in percentage of population with a disability between the ages 5 and 17.
Shoshone Disability Age 5 to 17
It is essential to understand that the correlation between the percentage of Shoshone and percentage of population with a disability between the ages 5 and 17 does not imply a direct cause-and-effect relationship. It remains uncertain whether the presence of Shoshone influences an upward or downward trend in the level of percentage of population with a disability between the ages 5 and 17 within an area, or if Shoshone simply ended up residing in those areas with higher or lower levels of percentage of population with a disability between the ages 5 and 17 due to other factors.

Demographics Similar to Shoshone by Disability Age 5 to 17

In terms of disability age 5 to 17, the demographic groups most similar to Shoshone are Immigrants from Central America (5.6%, a difference of 0.0%), Costa Rican (5.6%, a difference of 0.030%), Uruguayan (5.6%, a difference of 0.080%), Immigrants from Western Europe (5.6%, a difference of 0.080%), and Immigrants from Trinidad and Tobago (5.6%, a difference of 0.090%).
DemographicsRating | RankDisability Age 5 to 17
Iraqis
56.0
/100
|
#168
Average
5.6%
Immigrants from Norway
55.7
/100
|
#169
Average
5.6%
Serbians
54.0
/100
|
#170
Average
5.6%
Immigrants from Iraq
53.9
/100
|
#171
Average
5.6%
Ukrainians
51.5
/100
|
#172
Average
5.6%
Uruguayans
51.0
/100
|
#173
Average
5.6%
Costa Ricans
50.0
/100
|
#174
Average
5.6%
Shoshone
49.4
/100
|
#175
Average
5.6%
Immigrants from Central America
49.4
/100
|
#176
Average
5.6%
Immigrants from Western Europe
47.8
/100
|
#177
Average
5.6%
Immigrants from Trinidad and Tobago
47.6
/100
|
#178
Average
5.6%
Immigrants from Barbados
40.5
/100
|
#179
Average
5.6%
Immigrants from Uruguay
37.7
/100
|
#180
Fair
5.6%
Immigrants from England
36.4
/100
|
#181
Fair
5.6%
Mexican American Indians
35.2
/100
|
#182
Fair
5.6%

Shoshone Disability Age 5 to 17 Correlation Summary

MeasurementShoshone DataDisability Age 5 to 17 Data
Minimum0.025%0.97%
Maximum81.5%20.0%
Range81.5%19.0%
Mean12.5%7.6%
Median4.7%6.6%
Interquartile 25% (IQ1)2.2%4.6%
Interquartile 75% (IQ3)8.0%9.3%
Interquartile Range (IQR)5.8%4.7%
Standard Deviation (Sample)21.4%4.7%
Standard Deviation (Population)21.0%4.6%

Correlation Details

Shoshone PercentileSample SizeDisability Age 5 to 17
[
0.0%
-
0.5%
]
0.025%
65,296,3025.7%
[
0.0%
-
0.5%
]
0.47%
647,2536.9%
[
0.5%
-
1.0%
]
0.76%
283,5926.6%
[
1.0%
-
1.5%
]
1.07%
65,6055.3%
[
1.0%
-
1.5%
]
1.45%
76,1115.6%
[
1.5%
-
2.0%
]
1.71%
9,2865.4%
[
2.0%
-
2.5%
]
2.08%
3,02610.8%
[
2.0%
-
2.5%
]
2.37%
32,2376.7%
[
2.5%
-
3.0%
]
2.64%
2,2366.1%
[
3.0%
-
3.5%
]
3.07%
12,1513.6%
[
3.0%
-
3.5%
]
3.39%
29,1453.2%
[
3.5%
-
4.0%
]
3.61%
1,1076.1%
[
3.5%
-
4.0%
]
3.94%
48210.3%
[
4.0%
-
4.5%
]
4.30%
3,2586.0%
[
4.5%
-
5.0%
]
4.70%
3,9573.9%
[
5.0%
-
5.5%
]
5.13%
2,3969.4%
[
5.5%
-
6.0%
]
5.63%
6409.1%
[
5.5%
-
6.0%
]
5.96%
7,2128.5%
[
6.0%
-
6.5%
]
6.21%
2902.9%
[
6.5%
-
7.0%
]
6.68%
13,9892.2%
[
7.0%
-
7.5%
]
7.16%
1,0199.0%
[
7.0%
-
7.5%
]
7.50%
24018.9%
[
8.5%
-
9.0%
]
8.51%
2,60812.8%
[
8.5%
-
9.0%
]
8.83%
2,2657.6%
[
23.0%
-
23.5%
]
23.08%
7820.0%
[
30.0%
-
30.5%
]
30.15%
19915.8%
[
63.5%
-
64.0%
]
63.88%
1,4810.97%
[
68.0%
-
68.5%
]
68.01%
1,4101.9%
[
81.5%
-
82.0%
]
81.51%
1468.3%