Bulgarian Disability Age 5 to 17
COMPARE
Bulgarian
Select to Compare
Disability Age 5 to 17
Bulgarian Disability Age 5 to 17
5.2%
DISABILITY | AGE 5 TO 17
99.4/ 100
METRIC RATING
85th/ 347
METRIC RANK
Bulgarian Disability Age 5 to 17 Correlation Chart
The statistical analysis conducted on geographies consisting of 204,463,021 people shows a poor positive correlation between the proportion of Bulgarians and percentage of population with a disability between the ages 5 and 17 in the United States with a correlation coefficient (R) of 0.105 and weighted average of 5.2%. On average, for every 1% (one percent) increase in Bulgarians within a typical geography, there is an increase of 0.40% in percentage of population with a disability between the ages 5 and 17.
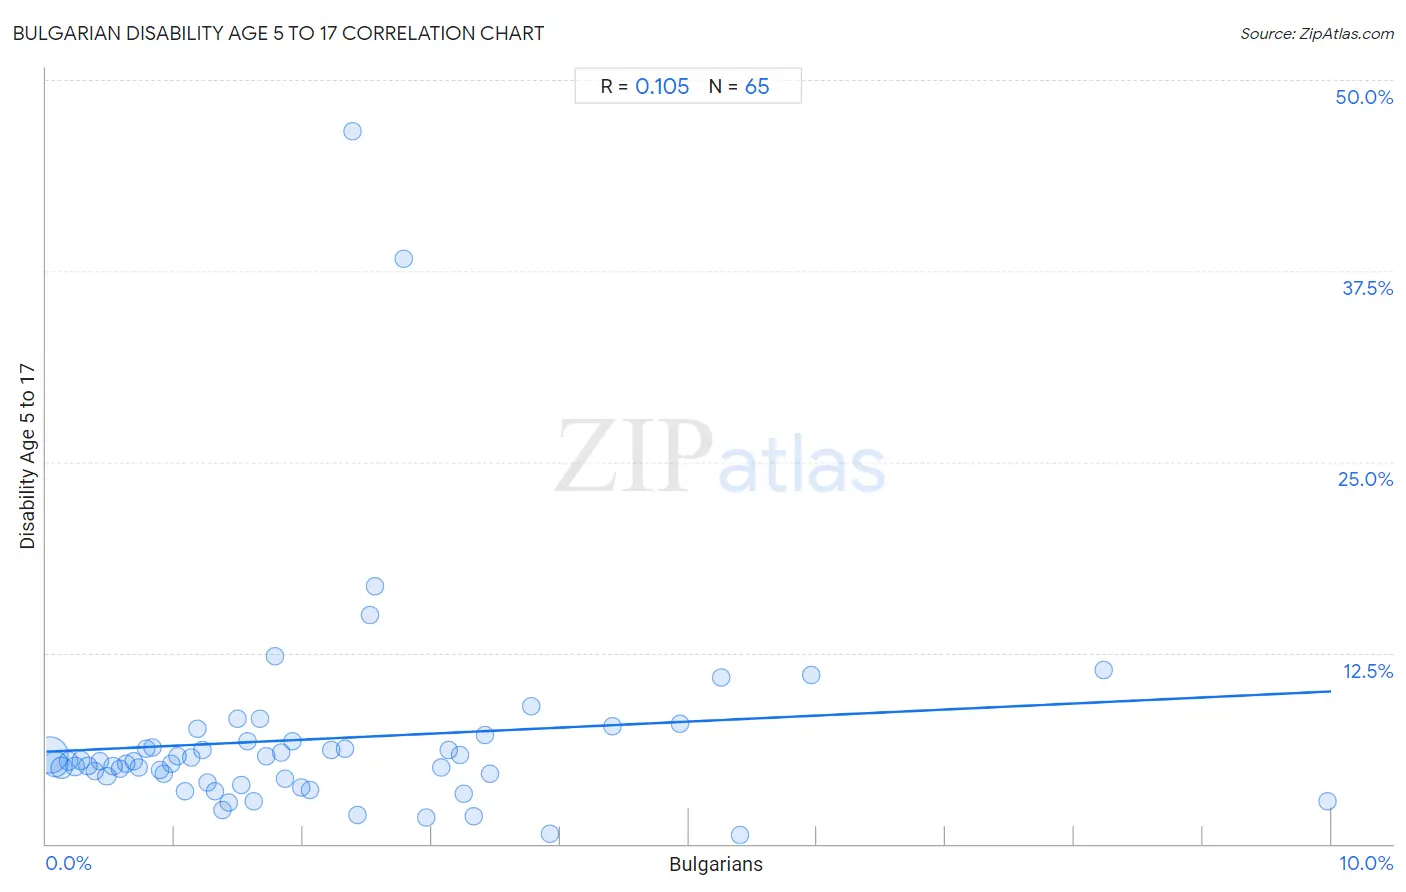
It is essential to understand that the correlation between the percentage of Bulgarians and percentage of population with a disability between the ages 5 and 17 does not imply a direct cause-and-effect relationship. It remains uncertain whether the presence of Bulgarians influences an upward or downward trend in the level of percentage of population with a disability between the ages 5 and 17 within an area, or if Bulgarians simply ended up residing in those areas with higher or lower levels of percentage of population with a disability between the ages 5 and 17 due to other factors.
Demographics Similar to Bulgarians by Disability Age 5 to 17
In terms of disability age 5 to 17, the demographic groups most similar to Bulgarians are Immigrants from St. Vincent and the Grenadines (5.2%, a difference of 0.040%), Immigrants from Nicaragua (5.2%, a difference of 0.070%), Eastern European (5.2%, a difference of 0.080%), Immigrants from Croatia (5.2%, a difference of 0.12%), and Immigrants from Spain (5.2%, a difference of 0.12%).
| Demographics | Rating | Rank | Disability Age 5 to 17 |
| Immigrants from Cuba | 99.6 /100 | #78 | Exceptional 5.2% |
| Afghans | 99.6 /100 | #79 | Exceptional 5.2% |
| Sri Lankans | 99.6 /100 | #80 | Exceptional 5.2% |
| Native Hawaiians | 99.6 /100 | #81 | Exceptional 5.2% |
| Immigrants from Sweden | 99.5 /100 | #82 | Exceptional 5.2% |
| Immigrants from France | 99.5 /100 | #83 | Exceptional 5.2% |
| Immigrants from Nicaragua | 99.5 /100 | #84 | Exceptional 5.2% |
| Bulgarians | 99.4 /100 | #85 | Exceptional 5.2% |
| Immigrants from St. Vincent and the Grenadines | 99.4 /100 | #86 | Exceptional 5.2% |
| Eastern Europeans | 99.4 /100 | #87 | Exceptional 5.2% |
| Immigrants from Croatia | 99.4 /100 | #88 | Exceptional 5.2% |
| Immigrants from Spain | 99.4 /100 | #89 | Exceptional 5.2% |
| Immigrants from Kuwait | 99.4 /100 | #90 | Exceptional 5.3% |
| Mongolians | 99.2 /100 | #91 | Exceptional 5.3% |
| Luxembourgers | 99.2 /100 | #92 | Exceptional 5.3% |
Bulgarian Disability Age 5 to 17 Correlation Summary
| Measurement | Bulgarian Data | Disability Age 5 to 17 Data |
| Minimum | 0.025% | 0.57% |
| Maximum | 10.0% | 46.7% |
| Range | 9.9% | 46.1% |
| Mean | 2.1% | 6.9% |
| Median | 1.6% | 5.4% |
| Interquartile 25% (IQ1) | 0.80% | 4.1% |
| Interquartile 75% (IQ3) | 3.0% | 6.7% |
| Interquartile Range (IQR) | 2.2% | 2.6% |
| Standard Deviation (Sample) | 1.9% | 7.1% |
| Standard Deviation (Population) | 1.9% | 7.0% |
Correlation Details
| Bulgarian Percentile | Sample Size | Disability Age 5 to 17 |
[ 0.0% - 0.5% ] 0.025% | 113,779,088 | 5.8% |
[ 0.0% - 0.5% ] 0.072% | 40,753,405 | 5.2% |
[ 0.0% - 0.5% ] 0.12% | 18,999,572 | 5.0% |
[ 0.0% - 0.5% ] 0.17% | 9,459,918 | 5.4% |
[ 0.0% - 0.5% ] 0.22% | 5,776,672 | 5.1% |
[ 0.0% - 0.5% ] 0.27% | 3,458,799 | 5.5% |
[ 0.0% - 0.5% ] 0.32% | 3,351,671 | 5.1% |
[ 0.0% - 0.5% ] 0.38% | 1,686,301 | 4.7% |
[ 0.0% - 0.5% ] 0.42% | 1,020,372 | 5.4% |
[ 0.0% - 0.5% ] 0.47% | 872,729 | 4.4% |
[ 0.5% - 1.0% ] 0.52% | 924,487 | 5.1% |
[ 0.5% - 1.0% ] 0.57% | 646,707 | 4.9% |
[ 0.5% - 1.0% ] 0.62% | 477,315 | 5.3% |
[ 0.5% - 1.0% ] 0.68% | 426,231 | 5.4% |
[ 0.5% - 1.0% ] 0.72% | 274,108 | 5.0% |
[ 0.5% - 1.0% ] 0.78% | 360,557 | 6.2% |
[ 0.5% - 1.0% ] 0.83% | 136,149 | 6.3% |
[ 0.5% - 1.0% ] 0.88% | 311,842 | 4.8% |
[ 0.5% - 1.0% ] 0.92% | 104,176 | 4.6% |
[ 0.5% - 1.0% ] 0.97% | 119,497 | 5.3% |
[ 1.0% - 1.5% ] 1.02% | 240,523 | 5.8% |
[ 1.0% - 1.5% ] 1.08% | 99,382 | 3.4% |
[ 1.0% - 1.5% ] 1.13% | 73,659 | 5.6% |
[ 1.0% - 1.5% ] 1.17% | 56,037 | 7.5% |
[ 1.0% - 1.5% ] 1.22% | 72,926 | 6.1% |
[ 1.0% - 1.5% ] 1.25% | 120,821 | 4.0% |
[ 1.0% - 1.5% ] 1.31% | 92,291 | 3.5% |
[ 1.0% - 1.5% ] 1.37% | 17,922 | 2.2% |
[ 1.0% - 1.5% ] 1.42% | 12,075 | 2.7% |
[ 1.0% - 1.5% ] 1.49% | 24,054 | 8.2% |
[ 1.5% - 2.0% ] 1.52% | 142,943 | 3.8% |
[ 1.5% - 2.0% ] 1.57% | 39,359 | 6.7% |
[ 1.5% - 2.0% ] 1.61% | 11,645 | 2.8% |
[ 1.5% - 2.0% ] 1.66% | 7,088 | 8.2% |
[ 1.5% - 2.0% ] 1.71% | 30,334 | 5.8% |
[ 1.5% - 2.0% ] 1.78% | 23,795 | 12.3% |
[ 1.5% - 2.0% ] 1.83% | 100,974 | 6.0% |
[ 1.5% - 2.0% ] 1.86% | 65,514 | 4.3% |
[ 1.5% - 2.0% ] 1.91% | 14,936 | 6.7% |
[ 1.5% - 2.0% ] 1.99% | 65,266 | 3.7% |
[ 2.0% - 2.5% ] 2.06% | 30,650 | 3.6% |
[ 2.0% - 2.5% ] 2.22% | 29,574 | 6.1% |
[ 2.0% - 2.5% ] 2.33% | 40,140 | 6.2% |
[ 2.0% - 2.5% ] 2.38% | 378 | 46.7% |
[ 2.0% - 2.5% ] 2.42% | 29,216 | 1.9% |
[ 2.5% - 3.0% ] 2.52% | 3,689 | 15.0% |
[ 2.5% - 3.0% ] 2.56% | 313 | 16.8% |
[ 2.5% - 3.0% ] 2.78% | 863 | 38.3% |
[ 2.5% - 3.0% ] 2.96% | 3,613 | 1.7% |
[ 3.0% - 3.5% ] 3.07% | 10,390 | 5.0% |
[ 3.0% - 3.5% ] 3.14% | 14,191 | 6.2% |
[ 3.0% - 3.5% ] 3.22% | 901 | 5.8% |
[ 3.0% - 3.5% ] 3.25% | 9,929 | 3.3% |
[ 3.0% - 3.5% ] 3.33% | 11,706 | 1.8% |
[ 3.0% - 3.5% ] 3.41% | 4,514 | 7.1% |
[ 3.0% - 3.5% ] 3.45% | 5,213 | 4.6% |
[ 3.5% - 4.0% ] 3.77% | 4,080 | 9.0% |
[ 3.5% - 4.0% ] 3.92% | 2,627 | 0.67% |
[ 4.0% - 4.5% ] 4.41% | 227 | 7.7% |
[ 4.5% - 5.0% ] 4.93% | 3,306 | 7.8% |
[ 5.0% - 5.5% ] 5.25% | 1,275 | 10.9% |
[ 5.0% - 5.5% ] 5.40% | 593 | 0.57% |
[ 5.5% - 6.0% ] 5.95% | 3,042 | 11.0% |
[ 8.0% - 8.5% ] 8.23% | 328 | 11.3% |
[ 9.5% - 10.0% ] 9.97% | 1,123 | 2.8% |