Immigrants from Philippines Disability Age 5 to 17
COMPARE
Immigrants from Philippines
Select to Compare
Disability Age 5 to 17
Immigrants from Philippines Disability Age 5 to 17
5.0%
DISABILITY | AGE 5 TO 17
100.0/ 100
METRIC RATING
38th/ 347
METRIC RANK
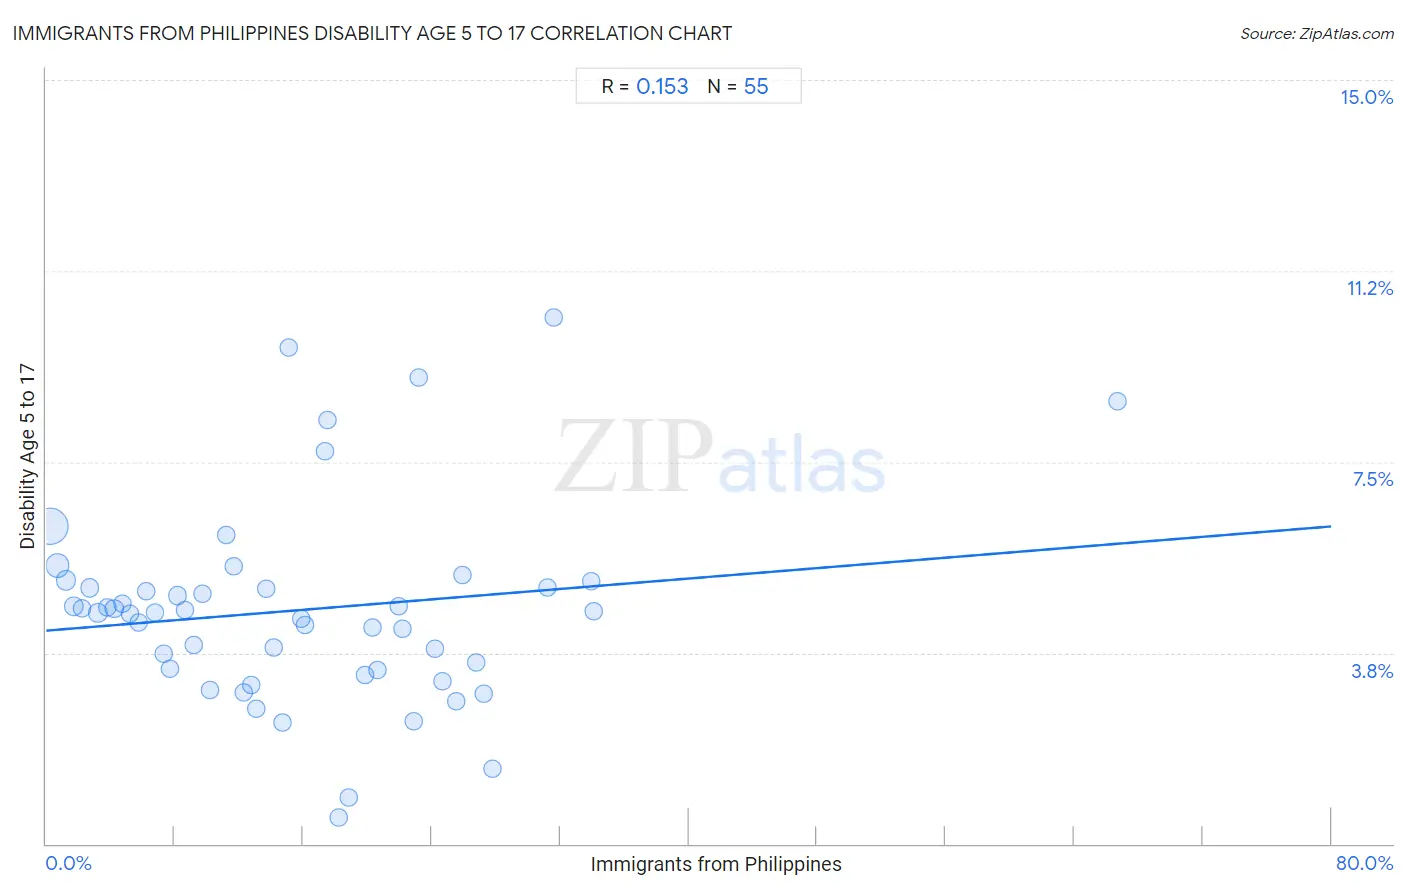
Immigrants from Philippines Disability Age 5 to 17 Correlation Chart
The statistical analysis conducted on geographies consisting of 466,357,424 people shows a poor positive correlation between the proportion of Immigrants from Philippines and percentage of population with a disability between the ages 5 and 17 in the United States with a correlation coefficient (R) of 0.153 and weighted average of 5.0%. On average, for every 1% (one percent) increase in Immigrants from Philippines within a typical geography, there is an increase of 0.026% in percentage of population with a disability between the ages 5 and 17.
It is essential to understand that the correlation between the percentage of Immigrants from Philippines and percentage of population with a disability between the ages 5 and 17 does not imply a direct cause-and-effect relationship. It remains uncertain whether the presence of Immigrants from Philippines influences an upward or downward trend in the level of percentage of population with a disability between the ages 5 and 17 within an area, or if Immigrants from Philippines simply ended up residing in those areas with higher or lower levels of percentage of population with a disability between the ages 5 and 17 due to other factors.
Demographics Similar to Immigrants from Philippines by Disability Age 5 to 17
In terms of disability age 5 to 17, the demographic groups most similar to Immigrants from Philippines are Immigrants from Argentina (5.0%, a difference of 0.010%), Immigrants from Belarus (5.0%, a difference of 0.040%), Immigrants from Egypt (5.0%, a difference of 0.070%), Okinawan (5.0%, a difference of 0.090%), and Bolivian (5.0%, a difference of 0.11%).
| Demographics | Rating | Rank | Disability Age 5 to 17 |
| Immigrants from Pakistan | 100.0 /100 | #31 | Exceptional 5.0% |
| Soviet Union | 100.0 /100 | #32 | Exceptional 5.0% |
| Immigrants from Indonesia | 100.0 /100 | #33 | Exceptional 5.0% |
| Israelis | 100.0 /100 | #34 | Exceptional 5.0% |
| Bolivians | 100.0 /100 | #35 | Exceptional 5.0% |
| Immigrants from Egypt | 100.0 /100 | #36 | Exceptional 5.0% |
| Immigrants from Belarus | 100.0 /100 | #37 | Exceptional 5.0% |
| Immigrants from Philippines | 100.0 /100 | #38 | Exceptional 5.0% |
| Immigrants from Argentina | 100.0 /100 | #39 | Exceptional 5.0% |
| Okinawans | 100.0 /100 | #40 | Exceptional 5.0% |
| Immigrants from Australia | 100.0 /100 | #41 | Exceptional 5.0% |
| Immigrants from Sri Lanka | 100.0 /100 | #42 | Exceptional 5.0% |
| Immigrants from Russia | 100.0 /100 | #43 | Exceptional 5.0% |
| Egyptians | 100.0 /100 | #44 | Exceptional 5.0% |
| Tongans | 100.0 /100 | #45 | Exceptional 5.0% |
Immigrants from Philippines Disability Age 5 to 17 Correlation Summary
| Measurement | Immigrants from Philippines Data | Disability Age 5 to 17 Data |
| Minimum | 0.21% | 0.51% |
| Maximum | 66.7% | 10.3% |
| Range | 66.5% | 9.8% |
| Mean | 15.7% | 4.6% |
| Median | 14.2% | 4.5% |
| Interquartile 25% (IQ1) | 6.8% | 3.4% |
| Interquartile 75% (IQ3) | 22.9% | 5.0% |
| Interquartile Range (IQR) | 16.1% | 1.6% |
| Standard Deviation (Sample) | 11.7% | 2.0% |
| Standard Deviation (Population) | 11.6% | 1.9% |
Correlation Details
| Immigrants from Philippines Percentile | Sample Size | Disability Age 5 to 17 |
[ 0.0% - 0.5% ] 0.21% | 294,154,308 | 6.2% |
[ 0.5% - 1.0% ] 0.70% | 79,934,272 | 5.5% |
[ 1.0% - 1.5% ] 1.24% | 28,342,678 | 5.2% |
[ 1.5% - 2.0% ] 1.72% | 16,967,718 | 4.7% |
[ 2.0% - 2.5% ] 2.23% | 13,339,440 | 4.6% |
[ 2.5% - 3.0% ] 2.71% | 8,636,249 | 5.0% |
[ 3.0% - 3.5% ] 3.21% | 8,011,765 | 4.5% |
[ 3.5% - 4.0% ] 3.78% | 3,483,594 | 4.6% |
[ 4.0% - 4.5% ] 4.24% | 3,058,499 | 4.6% |
[ 4.5% - 5.0% ] 4.71% | 1,729,547 | 4.7% |
[ 5.0% - 5.5% ] 5.21% | 684,522 | 4.5% |
[ 5.5% - 6.0% ] 5.76% | 1,373,596 | 4.3% |
[ 6.0% - 6.5% ] 6.19% | 982,827 | 5.0% |
[ 6.5% - 7.0% ] 6.76% | 772,122 | 4.5% |
[ 7.0% - 7.5% ] 7.28% | 512,748 | 3.7% |
[ 7.5% - 8.0% ] 7.72% | 874,734 | 3.4% |
[ 8.0% - 8.5% ] 8.17% | 736,288 | 4.9% |
[ 8.5% - 9.0% ] 8.65% | 244,070 | 4.6% |
[ 9.0% - 9.5% ] 9.21% | 275,013 | 3.9% |
[ 9.5% - 10.0% ] 9.70% | 8,487 | 4.9% |
[ 10.0% - 10.5% ] 10.22% | 151,897 | 3.0% |
[ 11.0% - 11.5% ] 11.23% | 98,961 | 6.1% |
[ 11.5% - 12.0% ] 11.66% | 265,513 | 5.4% |
[ 12.0% - 12.5% ] 12.28% | 423,749 | 3.0% |
[ 12.5% - 13.0% ] 12.79% | 116,900 | 3.1% |
[ 13.0% - 13.5% ] 13.07% | 20,104 | 2.7% |
[ 13.5% - 14.0% ] 13.71% | 180,581 | 5.0% |
[ 14.0% - 14.5% ] 14.15% | 152,755 | 3.8% |
[ 14.5% - 15.0% ] 14.73% | 49,879 | 2.4% |
[ 15.0% - 15.5% ] 15.14% | 3,766 | 9.8% |
[ 15.5% - 16.0% ] 15.88% | 52,207 | 4.4% |
[ 16.0% - 16.5% ] 16.13% | 130,742 | 4.3% |
[ 17.0% - 17.5% ] 17.35% | 4,506 | 7.7% |
[ 17.5% - 18.0% ] 17.51% | 337 | 8.3% |
[ 18.0% - 18.5% ] 18.22% | 4,628 | 0.51% |
[ 18.5% - 19.0% ] 18.84% | 12,906 | 0.91% |
[ 19.5% - 20.0% ] 19.86% | 65,125 | 3.3% |
[ 20.0% - 20.5% ] 20.28% | 208,714 | 4.2% |
[ 20.5% - 21.0% ] 20.61% | 6,469 | 3.4% |
[ 21.5% - 22.0% ] 21.96% | 16,218 | 4.7% |
[ 22.0% - 22.5% ] 22.22% | 2,255 | 4.2% |
[ 22.5% - 23.0% ] 22.87% | 3,218 | 2.4% |
[ 23.0% - 23.5% ] 23.18% | 4,194 | 9.2% |
[ 24.0% - 24.5% ] 24.18% | 28,090 | 3.8% |
[ 24.5% - 25.0% ] 24.71% | 52,328 | 3.2% |
[ 25.0% - 25.5% ] 25.49% | 25,902 | 2.8% |
[ 25.5% - 26.0% ] 25.90% | 72,605 | 5.3% |
[ 26.5% - 27.0% ] 26.79% | 922 | 3.6% |
[ 27.0% - 27.5% ] 27.24% | 16,457 | 3.0% |
[ 27.5% - 28.0% ] 27.79% | 6,550 | 1.5% |
[ 31.0% - 31.5% ] 31.18% | 3,576 | 5.0% |
[ 31.5% - 32.0% ] 31.63% | 98 | 10.3% |
[ 33.5% - 34.0% ] 33.96% | 45,457 | 5.2% |
[ 34.0% - 34.5% ] 34.06% | 4,342 | 4.6% |
[ 66.5% - 67.0% ] 66.69% | 2,996 | 8.7% |