Czech Disability Age 5 to 17
COMPARE
Czech
Select to Compare
Disability Age 5 to 17
Czech Disability Age 5 to 17
5.8%
DISABILITY | AGE 5 TO 17
7.4/ 100
METRIC RATING
217th/ 347
METRIC RANK
Czech Disability Age 5 to 17 Correlation Chart
The statistical analysis conducted on geographies consisting of 477,643,997 people shows a weak positive correlation between the proportion of Czechs and percentage of population with a disability between the ages 5 and 17 in the United States with a correlation coefficient (R) of 0.255 and weighted average of 5.8%. On average, for every 1% (one percent) increase in Czechs within a typical geography, there is an increase of 0.14% in percentage of population with a disability between the ages 5 and 17.
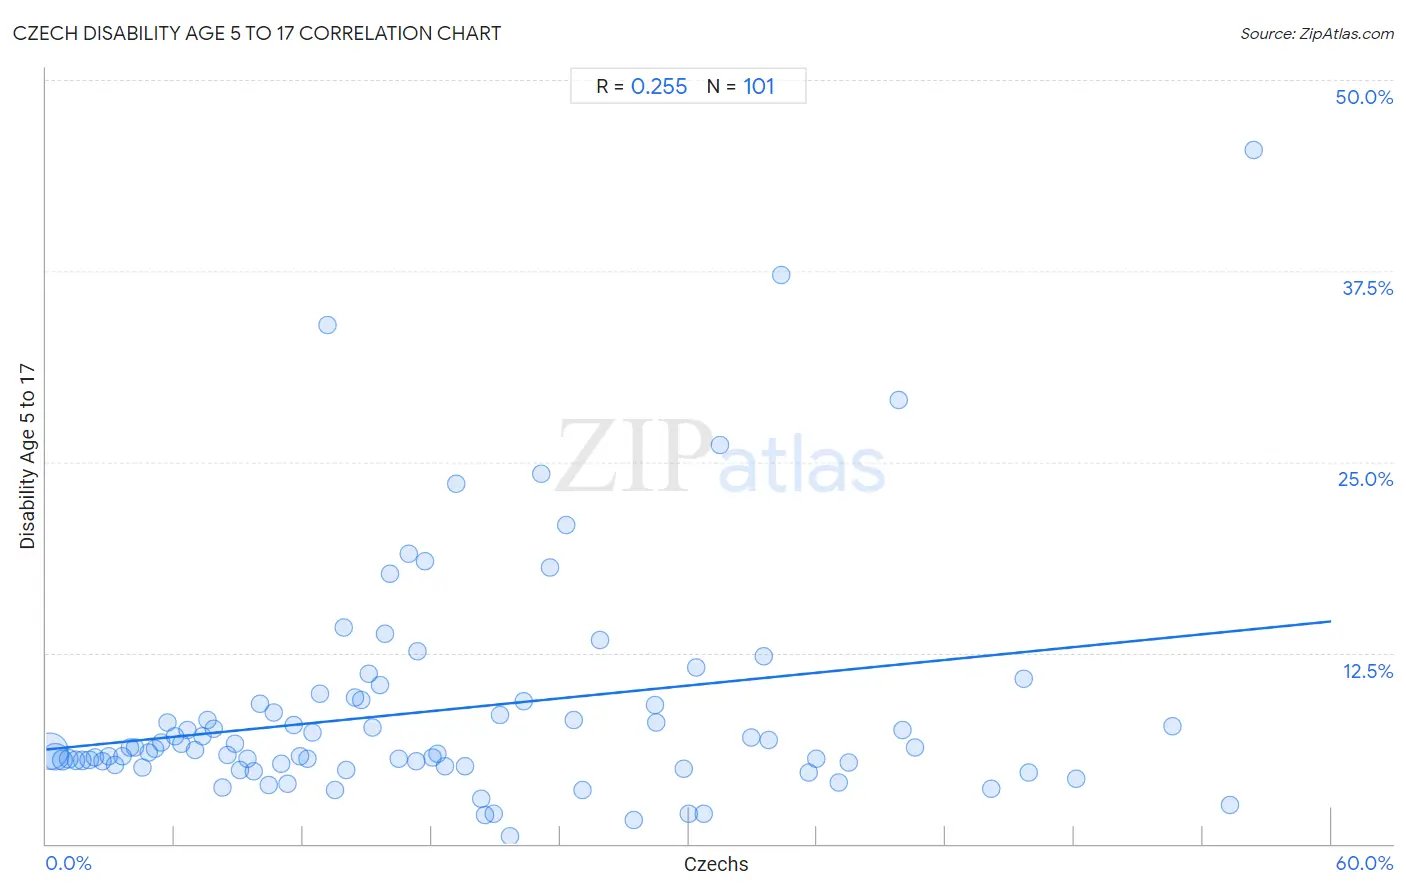
It is essential to understand that the correlation between the percentage of Czechs and percentage of population with a disability between the ages 5 and 17 does not imply a direct cause-and-effect relationship. It remains uncertain whether the presence of Czechs influences an upward or downward trend in the level of percentage of population with a disability between the ages 5 and 17 within an area, or if Czechs simply ended up residing in those areas with higher or lower levels of percentage of population with a disability between the ages 5 and 17 due to other factors.
Demographics Similar to Czechs by Disability Age 5 to 17
In terms of disability age 5 to 17, the demographic groups most similar to Czechs are Nigerian (5.8%, a difference of 0.030%), Immigrants from Sierra Leone (5.8%, a difference of 0.050%), Sierra Leonean (5.8%, a difference of 0.060%), Belgian (5.8%, a difference of 0.080%), and Swedish (5.8%, a difference of 0.12%).
| Demographics | Rating | Rank | Disability Age 5 to 17 |
| Immigrants from Haiti | 9.5 /100 | #210 | Tragic 5.8% |
| Yugoslavians | 9.1 /100 | #211 | Tragic 5.8% |
| Immigrants from Panama | 8.7 /100 | #212 | Tragic 5.8% |
| Immigrants from Cameroon | 8.3 /100 | #213 | Tragic 5.8% |
| Immigrants from Morocco | 8.3 /100 | #214 | Tragic 5.8% |
| Swedes | 8.1 /100 | #215 | Tragic 5.8% |
| Nigerians | 7.5 /100 | #216 | Tragic 5.8% |
| Czechs | 7.4 /100 | #217 | Tragic 5.8% |
| Immigrants from Sierra Leone | 7.1 /100 | #218 | Tragic 5.8% |
| Sierra Leoneans | 7.0 /100 | #219 | Tragic 5.8% |
| Belgians | 6.9 /100 | #220 | Tragic 5.8% |
| Lithuanians | 6.7 /100 | #221 | Tragic 5.8% |
| Immigrants from Sudan | 6.7 /100 | #222 | Tragic 5.8% |
| Alsatians | 6.0 /100 | #223 | Tragic 5.8% |
| Mexicans | 5.7 /100 | #224 | Tragic 5.8% |
Czech Disability Age 5 to 17 Correlation Summary
| Measurement | Czech Data | Disability Age 5 to 17 Data |
| Minimum | 0.15% | 0.52% |
| Maximum | 56.4% | 45.5% |
| Range | 56.2% | 44.9% |
| Mean | 18.5% | 8.8% |
| Median | 15.6% | 6.2% |
| Interquartile 25% (IQ1) | 7.7% | 5.1% |
| Interquartile 75% (IQ3) | 27.9% | 9.3% |
| Interquartile Range (IQR) | 20.2% | 4.1% |
| Standard Deviation (Sample) | 13.7% | 7.5% |
| Standard Deviation (Population) | 13.6% | 7.5% |
Correlation Details
| Czech Percentile | Sample Size | Disability Age 5 to 17 |
[ 0.0% - 0.5% ] 0.15% | 276,005,801 | 6.1% |
[ 0.0% - 0.5% ] 0.43% | 114,114,426 | 5.7% |
[ 0.5% - 1.0% ] 0.75% | 38,364,863 | 5.5% |
[ 1.0% - 1.5% ] 1.06% | 18,566,579 | 5.5% |
[ 1.0% - 1.5% ] 1.38% | 10,368,339 | 5.5% |
[ 1.5% - 2.0% ] 1.69% | 6,191,620 | 5.5% |
[ 2.0% - 2.5% ] 2.01% | 3,876,662 | 5.5% |
[ 2.0% - 2.5% ] 2.30% | 2,084,161 | 5.7% |
[ 2.5% - 3.0% ] 2.61% | 1,544,328 | 5.4% |
[ 2.5% - 3.0% ] 2.92% | 1,061,652 | 5.7% |
[ 3.0% - 3.5% ] 3.23% | 1,251,527 | 5.2% |
[ 3.5% - 4.0% ] 3.55% | 566,080 | 5.7% |
[ 3.5% - 4.0% ] 3.89% | 377,879 | 6.3% |
[ 4.0% - 4.5% ] 4.13% | 595,499 | 6.3% |
[ 4.0% - 4.5% ] 4.49% | 596,470 | 5.0% |
[ 4.5% - 5.0% ] 4.79% | 447,299 | 6.0% |
[ 5.0% - 5.5% ] 5.06% | 293,047 | 6.2% |
[ 5.0% - 5.5% ] 5.36% | 252,450 | 6.6% |
[ 5.5% - 6.0% ] 5.65% | 81,193 | 8.0% |
[ 5.5% - 6.0% ] 6.00% | 68,199 | 7.0% |
[ 6.0% - 6.5% ] 6.28% | 64,852 | 6.5% |
[ 6.5% - 7.0% ] 6.62% | 124,090 | 7.5% |
[ 6.5% - 7.0% ] 6.96% | 59,844 | 6.1% |
[ 7.0% - 7.5% ] 7.32% | 67,493 | 7.0% |
[ 7.5% - 8.0% ] 7.55% | 63,610 | 8.1% |
[ 7.5% - 8.0% ] 7.83% | 45,706 | 7.5% |
[ 8.0% - 8.5% ] 8.23% | 54,068 | 3.7% |
[ 8.0% - 8.5% ] 8.46% | 41,366 | 5.8% |
[ 8.5% - 9.0% ] 8.81% | 26,502 | 6.5% |
[ 9.0% - 9.5% ] 9.04% | 11,466 | 4.8% |
[ 9.0% - 9.5% ] 9.38% | 10,373 | 5.5% |
[ 9.5% - 10.0% ] 9.71% | 19,646 | 4.7% |
[ 9.5% - 10.0% ] 9.97% | 18,064 | 9.2% |
[ 10.0% - 10.5% ] 10.38% | 18,743 | 3.9% |
[ 10.5% - 11.0% ] 10.61% | 10,447 | 8.6% |
[ 10.5% - 11.0% ] 10.96% | 33,963 | 5.2% |
[ 11.0% - 11.5% ] 11.25% | 30,123 | 3.9% |
[ 11.5% - 12.0% ] 11.54% | 8,845 | 7.8% |
[ 11.5% - 12.0% ] 11.87% | 5,317 | 5.7% |
[ 12.0% - 12.5% ] 12.20% | 13,102 | 5.5% |
[ 12.0% - 12.5% ] 12.43% | 9,859 | 7.3% |
[ 12.5% - 13.0% ] 12.78% | 6,551 | 9.8% |
[ 13.0% - 13.5% ] 13.15% | 2,714 | 33.9% |
[ 13.0% - 13.5% ] 13.49% | 11,931 | 3.6% |
[ 13.5% - 14.0% ] 13.88% | 1,174 | 14.1% |
[ 13.5% - 14.0% ] 13.99% | 25,743 | 4.9% |
[ 14.0% - 14.5% ] 14.43% | 8,335 | 9.5% |
[ 14.5% - 15.0% ] 14.73% | 5,477 | 9.4% |
[ 15.0% - 15.5% ] 15.05% | 12,414 | 11.2% |
[ 15.0% - 15.5% ] 15.23% | 3,343 | 7.6% |
[ 15.5% - 16.0% ] 15.60% | 19,592 | 10.4% |
[ 15.5% - 16.0% ] 15.84% | 3,107 | 13.7% |
[ 16.0% - 16.5% ] 16.06% | 965 | 17.6% |
[ 16.0% - 16.5% ] 16.43% | 986 | 5.6% |
[ 16.5% - 17.0% ] 16.90% | 1,645 | 19.0% |
[ 17.0% - 17.5% ] 17.29% | 4,864 | 5.4% |
[ 17.0% - 17.5% ] 17.34% | 796 | 12.6% |
[ 17.5% - 18.0% ] 17.71% | 2,738 | 18.5% |
[ 18.0% - 18.5% ] 18.05% | 6,797 | 5.7% |
[ 18.0% - 18.5% ] 18.30% | 5,307 | 5.9% |
[ 18.5% - 19.0% ] 18.62% | 1,391 | 5.1% |
[ 19.0% - 19.5% ] 19.13% | 115 | 23.5% |
[ 19.5% - 20.0% ] 19.55% | 1,770 | 5.1% |
[ 20.0% - 20.5% ] 20.29% | 547 | 3.0% |
[ 20.5% - 21.0% ] 20.50% | 6,424 | 1.9% |
[ 20.5% - 21.0% ] 20.91% | 1,889 | 1.9% |
[ 21.0% - 21.5% ] 21.16% | 7,821 | 8.5% |
[ 21.5% - 22.0% ] 21.66% | 1,967 | 0.52% |
[ 22.0% - 22.5% ] 22.27% | 6,605 | 9.3% |
[ 23.0% - 23.5% ] 23.11% | 1,043 | 24.2% |
[ 23.5% - 24.0% ] 23.55% | 8,723 | 18.1% |
[ 24.0% - 24.5% ] 24.29% | 708 | 20.9% |
[ 24.5% - 25.0% ] 24.62% | 1,653 | 8.1% |
[ 25.0% - 25.5% ] 25.04% | 1,122 | 3.6% |
[ 25.5% - 26.0% ] 25.86% | 1,388 | 13.4% |
[ 27.0% - 27.5% ] 27.41% | 321 | 1.6% |
[ 28.0% - 28.5% ] 28.40% | 514 | 9.1% |
[ 28.5% - 29.0% ] 28.51% | 7,766 | 7.9% |
[ 29.5% - 30.0% ] 29.76% | 1,865 | 4.9% |
[ 30.0% - 30.5% ] 30.00% | 700 | 2.0% |
[ 30.0% - 30.5% ] 30.38% | 609 | 11.5% |
[ 30.5% - 31.0% ] 30.72% | 1,605 | 2.0% |
[ 31.0% - 31.5% ] 31.45% | 477 | 26.1% |
[ 32.5% - 33.0% ] 32.94% | 513 | 6.9% |
[ 33.0% - 33.5% ] 33.48% | 1,643 | 12.3% |
[ 33.5% - 34.0% ] 33.71% | 5,233 | 6.8% |
[ 34.0% - 34.5% ] 34.31% | 204 | 37.2% |
[ 35.5% - 36.0% ] 35.60% | 663 | 4.7% |
[ 35.5% - 36.0% ] 35.94% | 256 | 5.6% |
[ 37.0% - 37.5% ] 37.02% | 1,210 | 4.0% |
[ 37.0% - 37.5% ] 37.45% | 275 | 5.4% |
[ 39.5% - 40.0% ] 39.83% | 118 | 29.1% |
[ 39.5% - 40.0% ] 39.95% | 2,095 | 7.4% |
[ 40.5% - 41.0% ] 40.59% | 2,237 | 6.3% |
[ 44.0% - 44.5% ] 44.10% | 288 | 3.6% |
[ 45.5% - 46.0% ] 45.63% | 458 | 10.8% |
[ 45.5% - 46.0% ] 45.90% | 366 | 4.7% |
[ 48.0% - 48.5% ] 48.10% | 553 | 4.3% |
[ 52.5% - 53.0% ] 52.57% | 253 | 7.7% |
[ 55.0% - 55.5% ] 55.28% | 123 | 2.6% |
[ 56.0% - 56.5% ] 56.39% | 454 | 45.5% |