Maltese Disability Age 5 to 17

COMPARE

Maltese
Race
Ancestry
AfghanAfricanAlaska NativeAlaskan AthabascanAlbanianAleutAlsatianAmericanApacheArabArapahoArgentineanArmenianAssyrian/Chaldean/SyriacAustralianAustrianBahamianBangladeshiBarbadianBasqueBelgianBelizeanBermudanBhutaneseBlackfeetBolivianBrazilianBritishBritish West IndianBulgarianBurmeseCajunCambodianCanadianCape VerdeanCarpatho RusynCelticCentral AmericanCentral American IndianCherokeeCheyenneChickasawChileanChineseChippewaChoctawColombianColvilleComancheCosta RicanCreeCreekCroatianCrowCubanCypriotCzechCzechoslovakianDanishDelawareDominicanDutchDutch West IndianEastern EuropeanEcuadorianEgyptianEnglishEstonianEthiopianEuropeanFijianFilipinoFinnishFrenchFrench American IndianFrench CanadianGermanGerman RussianGhanaianGreekGuamanian/ChamorroGuatemalanGuyaneseHaitianHmongHonduranHopiHoumaHungarianIcelanderIndian (Asian)IndonesianInupiatIranianIraqiIrishIroquoisIsraeliItalianJamaicanJapaneseJordanianKenyanKiowaKoreanLaotianLatvianLebaneseLiberianLithuanianLumbeeLuxembourgerMacedonianMalaysianMalteseMarshalleseMenomineeMexicanMexican American IndianMongolianMoroccanNative HawaiianNavajoNepaleseNew ZealanderNicaraguanNigerianNorthern EuropeanNorwegianOkinawanOsageOttawaPaiutePakistaniPalestinianPanamanianParaguayanPennsylvania GermanPeruvianPimaPolishPortuguesePotawatomiPuebloPuerto RicanPuget Sound SalishRomanianRussianSalvadoranSamoanScandinavianScotch-IrishScottishSeminoleSenegaleseSerbianShoshoneSierra LeoneanSiouxSlavicSlovakSloveneSomaliSouth AfricanSouth AmericanSouth American IndianSoviet UnionSpaniardSpanishSpanish AmericanSpanish American IndianSri LankanSubsaharan AfricanSudaneseSwedishSwissSyrianTaiwaneseThaiTlingit-HaidaTohono O'OdhamTonganTrinidadian and TobagonianTsimshianTurkishU.S. Virgin IslanderUgandanUkrainianUruguayanUteVenezuelanVietnameseWelshWest IndianYakamaYaquiYugoslavianYumanYup'ikZimbabwean
Immigration
NonimmigrantsImmigrantsAfghanistanAfricaAlbaniaArgentinaArmeniaAsiaAustraliaAustriaBahamasBangladeshBarbadosBelarusBelgiumBelizeBoliviaBosnia and HerzegovinaBrazilBulgariaBurma/MyanmarCabo VerdeCambodiaCameroonCanadaCaribbeanCentral AmericaChileChinaColombiaCongoCosta RicaCroatiaCubaCzechoslovakiaDenmarkDominicaDominican RepublicEastern AfricaEastern AsiaEastern EuropeEcuadorEgyptEl SalvadorEnglandEritreaEthiopiaEuropeFijiFranceGermanyGhanaGreeceGrenadaGuatemalaGuyanaHaitiHondurasHong KongHungaryIndiaIndonesiaIranIraqIrelandIsraelItalyJamaicaJapanJordanKazakhstanKenyaKoreaKuwaitLaosLatin AmericaLatviaLebanonLiberiaLithuaniaMalaysiaMexicoMicronesiaMiddle AfricaMoldovaMoroccoNepalNetherlandsNicaraguaNigeriaNorth AmericaNorth MacedoniaNorthern AfricaNorthern EuropeNorwayOceaniaPakistanPanamaPeruPhilippinesPolandPortugalRomaniaRussiaSaudi ArabiaScotlandSenegalSerbiaSierra LeoneSingaporeSomaliaSouth AfricaSouth AmericaSouth Central AsiaSouth Eastern AsiaSouthern EuropeSpainSri LankaSt. Vincent and the GrenadinesSudanSwedenSwitzerlandSyriaTaiwanThailandTrinidad and TobagoTurkeyUgandaUkraineUruguayUzbekistanVenezuelaVietnamWest IndiesWestern AfricaWestern AsiaWestern EuropeYemenZaireZimbabweAzores
Select to Compare
Race
Ancestry
AfghanAfricanAlaska NativeAlaskan AthabascanAlbanianAleutAlsatianAmericanApacheArabArapahoArgentineanArmenianAssyrian/Chaldean/SyriacAustralianAustrianBahamianBangladeshiBarbadianBasqueBelgianBelizeanBermudanBhutaneseBlackfeetBolivianBrazilianBritishBritish West IndianBulgarianBurmeseCajunCambodianCanadianCape VerdeanCarpatho RusynCelticCentral AmericanCentral American IndianCherokeeCheyenneChickasawChileanChineseChippewaChoctawColombianColvilleComancheCosta RicanCreeCreekCroatianCrowCubanCypriotCzechCzechoslovakianDanishDelawareDominicanDutchDutch West IndianEastern EuropeanEcuadorianEgyptianEnglishEstonianEthiopianEuropeanFijianFilipinoFinnishFrenchFrench American IndianFrench CanadianGermanGerman RussianGhanaianGreekGuamanian/ChamorroGuatemalanGuyaneseHaitianHmongHonduranHopiHoumaHungarianIcelanderIndian (Asian)IndonesianInupiatIranianIraqiIrishIroquoisIsraeliItalianJamaicanJapaneseJordanianKenyanKiowaKoreanLaotianLatvianLebaneseLiberianLithuanianLumbeeLuxembourgerMacedonianMalaysianMarshalleseMenomineeMexicanMexican American IndianMongolianMoroccanNative HawaiianNavajoNepaleseNew ZealanderNicaraguanNigerianNorthern EuropeanNorwegianOkinawanOsageOttawaPaiutePakistaniPalestinianPanamanianParaguayanPennsylvania GermanPeruvianPimaPolishPortuguesePotawatomiPuebloPuerto RicanPuget Sound SalishRomanianRussianSalvadoranSamoanScandinavianScotch-IrishScottishSeminoleSenegaleseSerbianShoshoneSierra LeoneanSiouxSlavicSlovakSloveneSomaliSouth AfricanSouth AmericanSouth American IndianSoviet UnionSpaniardSpanishSpanish AmericanSpanish American IndianSri LankanSubsaharan AfricanSudaneseSwedishSwissSyrianTaiwaneseThaiTlingit-HaidaTohono O'OdhamTonganTrinidadian and TobagonianTsimshianTurkishU.S. Virgin IslanderUgandanUkrainianUruguayanUteVenezuelanVietnameseWelshWest IndianYakamaYaquiYugoslavianYumanYup'ikZimbabwean
Immigration
NonimmigrantsImmigrantsAfghanistanAfricaAlbaniaArgentinaArmeniaAsiaAustraliaAustriaBahamasBangladeshBarbadosBelarusBelgiumBelizeBoliviaBosnia and HerzegovinaBrazilBulgariaBurma/MyanmarCabo VerdeCambodiaCameroonCanadaCaribbeanCentral AmericaChileChinaColombiaCongoCosta RicaCroatiaCubaCzechoslovakiaDenmarkDominicaDominican RepublicEastern AfricaEastern AsiaEastern EuropeEcuadorEgyptEl SalvadorEnglandEritreaEthiopiaEuropeFijiFranceGermanyGhanaGreeceGrenadaGuatemalaGuyanaHaitiHondurasHong KongHungaryIndiaIndonesiaIranIraqIrelandIsraelItalyJamaicaJapanJordanKazakhstanKenyaKoreaKuwaitLaosLatin AmericaLatviaLebanonLiberiaLithuaniaMalaysiaMexicoMicronesiaMiddle AfricaMoldovaMoroccoNepalNetherlandsNicaraguaNigeriaNorth AmericaNorth MacedoniaNorthern AfricaNorthern EuropeNorwayOceaniaPakistanPanamaPeruPhilippinesPolandPortugalRomaniaRussiaSaudi ArabiaScotlandSenegalSerbiaSierra LeoneSingaporeSomaliaSouth AfricaSouth AmericaSouth Central AsiaSouth Eastern AsiaSouthern EuropeSpainSri LankaSt. Vincent and the GrenadinesSudanSwedenSwitzerlandSyriaTaiwanThailandTrinidad and TobagoTurkeyUgandaUkraineUruguayUzbekistanVenezuelaVietnamWest IndiesWestern AfricaWestern AsiaWestern EuropeYemenZaireZimbabweAzores
Disability Age 5 to 17
Income
Poverty
Unemployment
Labor Participation
Family Structure
Vehicle Availability
Education Level
Disability

Maltese Disability Age 5 to 17
Exceptional

5.4%
DISABILITY | AGE 5 TO 17
96.0/ 100
METRIC RATING
121st/ 347
METRIC RANK

Maltese Disability Age 5 to 17 Correlation Chart

The statistical analysis conducted on geographies consisting of 125,822,191 people shows a significant positive correlation between the proportion of Maltese and percentage of population with a disability between the ages 5 and 17 in the United States with a correlation coefficient (R) of 0.691 and weighted average of 5.4%. On average, for every 1% (one percent) increase in Maltese within a typical geography, there is an increase of 2.3% in percentage of population with a disability between the ages 5 and 17.
Maltese Disability Age 5 to 17
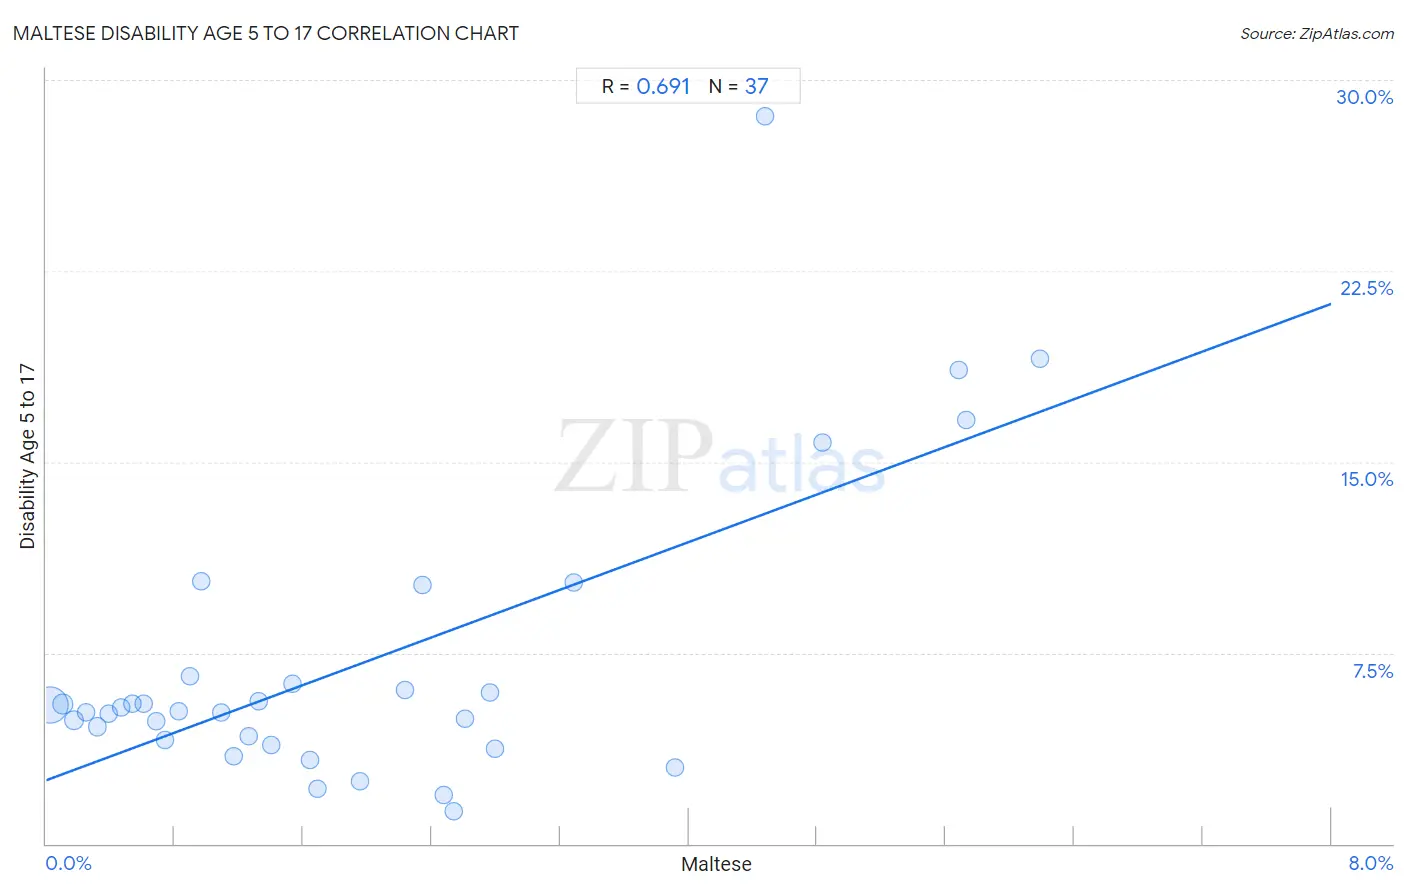
It is essential to understand that the correlation between the percentage of Maltese and percentage of population with a disability between the ages 5 and 17 does not imply a direct cause-and-effect relationship. It remains uncertain whether the presence of Maltese influences an upward or downward trend in the level of percentage of population with a disability between the ages 5 and 17 within an area, or if Maltese simply ended up residing in those areas with higher or lower levels of percentage of population with a disability between the ages 5 and 17 due to other factors.

Demographics Similar to Maltese by Disability Age 5 to 17

In terms of disability age 5 to 17, the demographic groups most similar to Maltese are Chilean (5.4%, a difference of 0.060%), Immigrants from Ethiopia (5.4%, a difference of 0.16%), Crow (5.4%, a difference of 0.29%), Immigrants from Chile (5.4%, a difference of 0.30%), and New Zealander (5.4%, a difference of 0.31%).
DemographicsRating | RankDisability Age 5 to 17
Immigrants from Northern Europe
97.8
/100
|
#114
Exceptional
5.3%
Cubans
97.8
/100
|
#115
Exceptional
5.3%
Cypriots
97.7
/100
|
#116
Exceptional
5.3%
Immigrants from Afghanistan
97.4
/100
|
#117
Exceptional
5.3%
South Americans
97.1
/100
|
#118
Exceptional
5.4%
Immigrants from South America
97.1
/100
|
#119
Exceptional
5.4%
Immigrants
97.0
/100
|
#120
Exceptional
5.4%
Maltese
96.0
/100
|
#121
Exceptional
5.4%
Chileans
95.8
/100
|
#122
Exceptional
5.4%
Immigrants from Ethiopia
95.5
/100
|
#123
Exceptional
5.4%
Crow
95.0
/100
|
#124
Exceptional
5.4%
Immigrants from Chile
95.0
/100
|
#125
Exceptional
5.4%
New Zealanders
95.0
/100
|
#126
Exceptional
5.4%
Latvians
95.0
/100
|
#127
Exceptional
5.4%
Immigrants from Venezuela
94.5
/100
|
#128
Exceptional
5.4%

Maltese Disability Age 5 to 17 Correlation Summary

MeasurementMaltese DataDisability Age 5 to 17 Data
Minimum0.020%1.3%
Maximum6.2%28.6%
Range6.2%27.3%
Mean1.9%7.0%
Median1.4%5.2%
Interquartile 25% (IQ1)0.65%4.0%
Interquartile 75% (IQ3)2.7%6.4%
Interquartile Range (IQR)2.0%2.5%
Standard Deviation (Sample)1.7%5.7%
Standard Deviation (Population)1.7%5.6%

Correlation Details

Maltese PercentileSample SizeDisability Age 5 to 17
[
0.0%
-
0.5%
]
0.020%
104,302,6515.5%
[
0.0%
-
0.5%
]
0.10%
10,569,8215.5%
[
0.0%
-
0.5%
]
0.17%
4,202,1514.9%
[
0.0%
-
0.5%
]
0.25%
2,126,1535.2%
[
0.0%
-
0.5%
]
0.32%
1,333,6254.6%
[
0.0%
-
0.5%
]
0.39%
806,0795.1%
[
0.0%
-
0.5%
]
0.46%
610,6875.3%
[
0.5%
-
1.0%
]
0.54%
571,0365.5%
[
0.5%
-
1.0%
]
0.61%
419,6645.5%
[
0.5%
-
1.0%
]
0.69%
264,6774.8%
[
0.5%
-
1.0%
]
0.74%
159,7914.1%
[
0.5%
-
1.0%
]
0.82%
23,9745.2%
[
0.5%
-
1.0%
]
0.89%
47,3306.6%
[
0.5%
-
1.0%
]
0.96%
22,36010.3%
[
1.0%
-
1.5%
]
1.09%
18,3925.1%
[
1.0%
-
1.5%
]
1.17%
66,3483.4%
[
1.0%
-
1.5%
]
1.26%
41,7704.2%
[
1.0%
-
1.5%
]
1.33%
113,7085.6%
[
1.0%
-
1.5%
]
1.40%
14,3923.9%
[
1.5%
-
2.0%
]
1.54%
19,8586.3%
[
1.5%
-
2.0%
]
1.64%
1,6463.3%
[
1.5%
-
2.0%
]
1.69%
3,7862.1%
[
1.5%
-
2.0%
]
1.95%
7,0232.5%
[
2.0%
-
2.5%
]
2.23%
21,3666.0%
[
2.0%
-
2.5%
]
2.34%
81110.1%
[
2.0%
-
2.5%
]
2.48%
4,7271.9%
[
2.5%
-
3.0%
]
2.54%
3,2321.3%
[
2.5%
-
3.0%
]
2.61%
9,1724.9%
[
2.5%
-
3.0%
]
2.76%
11,7765.9%
[
2.5%
-
3.0%
]
2.80%
2,8263.7%
[
3.0%
-
3.5%
]
3.29%
1,55210.3%
[
3.5%
-
4.0%
]
3.92%
6,4833.0%
[
4.0%
-
4.5%
]
4.48%
6728.6%
[
4.5%
-
5.0%
]
4.83%
2,87715.8%
[
5.5%
-
6.0%
]
5.68%
5,23118.6%
[
5.5%
-
6.0%
]
5.73%
34916.7%
[
6.0%
-
6.5%
]
6.19%
4,80019.1%