Tlingit-Haida Male Poverty

COMPARE

Tlingit-Haida
Race
Ancestry
AfghanAfricanAlaska NativeAlaskan AthabascanAlbanianAleutAlsatianAmericanApacheArabArapahoArgentineanArmenianAssyrian/Chaldean/SyriacAustralianAustrianBahamianBangladeshiBarbadianBasqueBelgianBelizeanBermudanBhutaneseBlackfeetBolivianBrazilianBritishBritish West IndianBulgarianBurmeseCajunCambodianCanadianCape VerdeanCarpatho RusynCelticCentral AmericanCentral American IndianCherokeeCheyenneChickasawChileanChineseChippewaChoctawColombianColvilleComancheCosta RicanCreeCreekCroatianCrowCubanCypriotCzechCzechoslovakianDanishDelawareDominicanDutchDutch West IndianEastern EuropeanEcuadorianEgyptianEnglishEstonianEthiopianEuropeanFijianFilipinoFinnishFrenchFrench American IndianFrench CanadianGermanGerman RussianGhanaianGreekGuamanian/ChamorroGuatemalanGuyaneseHaitianHmongHonduranHopiHoumaHungarianIcelanderIndian (Asian)IndonesianInupiatIranianIraqiIrishIroquoisIsraeliItalianJamaicanJapaneseJordanianKenyanKiowaKoreanLaotianLatvianLebaneseLiberianLithuanianLumbeeLuxembourgerMacedonianMalaysianMalteseMarshalleseMenomineeMexicanMexican American IndianMongolianMoroccanNative HawaiianNavajoNepaleseNew ZealanderNicaraguanNigerianNorthern EuropeanNorwegianOkinawanOsageOttawaPaiutePakistaniPalestinianPanamanianParaguayanPennsylvania GermanPeruvianPimaPolishPortuguesePotawatomiPuebloPuerto RicanPuget Sound SalishRomanianRussianSalvadoranSamoanScandinavianScotch-IrishScottishSeminoleSenegaleseSerbianShoshoneSierra LeoneanSiouxSlavicSlovakSloveneSomaliSouth AfricanSouth AmericanSouth American IndianSoviet UnionSpaniardSpanishSpanish AmericanSpanish American IndianSri LankanSubsaharan AfricanSudaneseSwedishSwissSyrianTaiwaneseThaiTlingit-HaidaTohono O'OdhamTonganTrinidadian and TobagonianTsimshianTurkishU.S. Virgin IslanderUgandanUkrainianUruguayanUteVenezuelanVietnameseWelshWest IndianYakamaYaquiYugoslavianYumanYup'ikZimbabwean
Immigration
NonimmigrantsImmigrantsAfghanistanAfricaAlbaniaArgentinaArmeniaAsiaAustraliaAustriaBahamasBangladeshBarbadosBelarusBelgiumBelizeBoliviaBosnia and HerzegovinaBrazilBulgariaBurma/MyanmarCabo VerdeCambodiaCameroonCanadaCaribbeanCentral AmericaChileChinaColombiaCongoCosta RicaCroatiaCubaCzechoslovakiaDenmarkDominicaDominican RepublicEastern AfricaEastern AsiaEastern EuropeEcuadorEgyptEl SalvadorEnglandEritreaEthiopiaEuropeFijiFranceGermanyGhanaGreeceGrenadaGuatemalaGuyanaHaitiHondurasHong KongHungaryIndiaIndonesiaIranIraqIrelandIsraelItalyJamaicaJapanJordanKazakhstanKenyaKoreaKuwaitLaosLatin AmericaLatviaLebanonLiberiaLithuaniaMalaysiaMexicoMicronesiaMiddle AfricaMoldovaMoroccoNepalNetherlandsNicaraguaNigeriaNorth AmericaNorth MacedoniaNorthern AfricaNorthern EuropeNorwayOceaniaPakistanPanamaPeruPhilippinesPolandPortugalRomaniaRussiaSaudi ArabiaScotlandSenegalSerbiaSierra LeoneSingaporeSomaliaSouth AfricaSouth AmericaSouth Central AsiaSouth Eastern AsiaSouthern EuropeSpainSri LankaSt. Vincent and the GrenadinesSudanSwedenSwitzerlandSyriaTaiwanThailandTrinidad and TobagoTurkeyUgandaUkraineUruguayUzbekistanVenezuelaVietnamWest IndiesWestern AfricaWestern AsiaWestern EuropeYemenZaireZimbabweAzores
Select to Compare
Race
Ancestry
AfghanAfricanAlaska NativeAlaskan AthabascanAlbanianAleutAlsatianAmericanApacheArabArapahoArgentineanArmenianAssyrian/Chaldean/SyriacAustralianAustrianBahamianBangladeshiBarbadianBasqueBelgianBelizeanBermudanBhutaneseBlackfeetBolivianBrazilianBritishBritish West IndianBulgarianBurmeseCajunCambodianCanadianCape VerdeanCarpatho RusynCelticCentral AmericanCentral American IndianCherokeeCheyenneChickasawChileanChineseChippewaChoctawColombianColvilleComancheCosta RicanCreeCreekCroatianCrowCubanCypriotCzechCzechoslovakianDanishDelawareDominicanDutchDutch West IndianEastern EuropeanEcuadorianEgyptianEnglishEstonianEthiopianEuropeanFijianFilipinoFinnishFrenchFrench American IndianFrench CanadianGermanGerman RussianGhanaianGreekGuamanian/ChamorroGuatemalanGuyaneseHaitianHmongHonduranHopiHoumaHungarianIcelanderIndian (Asian)IndonesianInupiatIranianIraqiIrishIroquoisIsraeliItalianJamaicanJapaneseJordanianKenyanKiowaKoreanLaotianLatvianLebaneseLiberianLithuanianLumbeeLuxembourgerMacedonianMalaysianMalteseMarshalleseMenomineeMexicanMexican American IndianMongolianMoroccanNative HawaiianNavajoNepaleseNew ZealanderNicaraguanNigerianNorthern EuropeanNorwegianOkinawanOsageOttawaPaiutePakistaniPalestinianPanamanianParaguayanPennsylvania GermanPeruvianPimaPolishPortuguesePotawatomiPuebloPuerto RicanPuget Sound SalishRomanianRussianSalvadoranSamoanScandinavianScotch-IrishScottishSeminoleSenegaleseSerbianShoshoneSierra LeoneanSiouxSlavicSlovakSloveneSomaliSouth AfricanSouth AmericanSouth American IndianSoviet UnionSpaniardSpanishSpanish AmericanSpanish American IndianSri LankanSubsaharan AfricanSudaneseSwedishSwissSyrianTaiwaneseThaiTohono O'OdhamTonganTrinidadian and TobagonianTsimshianTurkishU.S. Virgin IslanderUgandanUkrainianUruguayanUteVenezuelanVietnameseWelshWest IndianYakamaYaquiYugoslavianYumanYup'ikZimbabwean
Immigration
NonimmigrantsImmigrantsAfghanistanAfricaAlbaniaArgentinaArmeniaAsiaAustraliaAustriaBahamasBangladeshBarbadosBelarusBelgiumBelizeBoliviaBosnia and HerzegovinaBrazilBulgariaBurma/MyanmarCabo VerdeCambodiaCameroonCanadaCaribbeanCentral AmericaChileChinaColombiaCongoCosta RicaCroatiaCubaCzechoslovakiaDenmarkDominicaDominican RepublicEastern AfricaEastern AsiaEastern EuropeEcuadorEgyptEl SalvadorEnglandEritreaEthiopiaEuropeFijiFranceGermanyGhanaGreeceGrenadaGuatemalaGuyanaHaitiHondurasHong KongHungaryIndiaIndonesiaIranIraqIrelandIsraelItalyJamaicaJapanJordanKazakhstanKenyaKoreaKuwaitLaosLatin AmericaLatviaLebanonLiberiaLithuaniaMalaysiaMexicoMicronesiaMiddle AfricaMoldovaMoroccoNepalNetherlandsNicaraguaNigeriaNorth AmericaNorth MacedoniaNorthern AfricaNorthern EuropeNorwayOceaniaPakistanPanamaPeruPhilippinesPolandPortugalRomaniaRussiaSaudi ArabiaScotlandSenegalSerbiaSierra LeoneSingaporeSomaliaSouth AfricaSouth AmericaSouth Central AsiaSouth Eastern AsiaSouthern EuropeSpainSri LankaSt. Vincent and the GrenadinesSudanSwedenSwitzerlandSyriaTaiwanThailandTrinidad and TobagoTurkeyUgandaUkraineUruguayUzbekistanVenezuelaVietnamWest IndiesWestern AfricaWestern AsiaWestern EuropeYemenZaireZimbabweAzores
Male Poverty
Income
Poverty
Unemployment
Labor Participation
Family Structure
Vehicle Availability
Education Level
Disability

Tlingit-Haida Male Poverty
Good

10.9%
POVERTY | MALES
76.1/ 100
METRIC RATING
140th/ 347
METRIC RANK

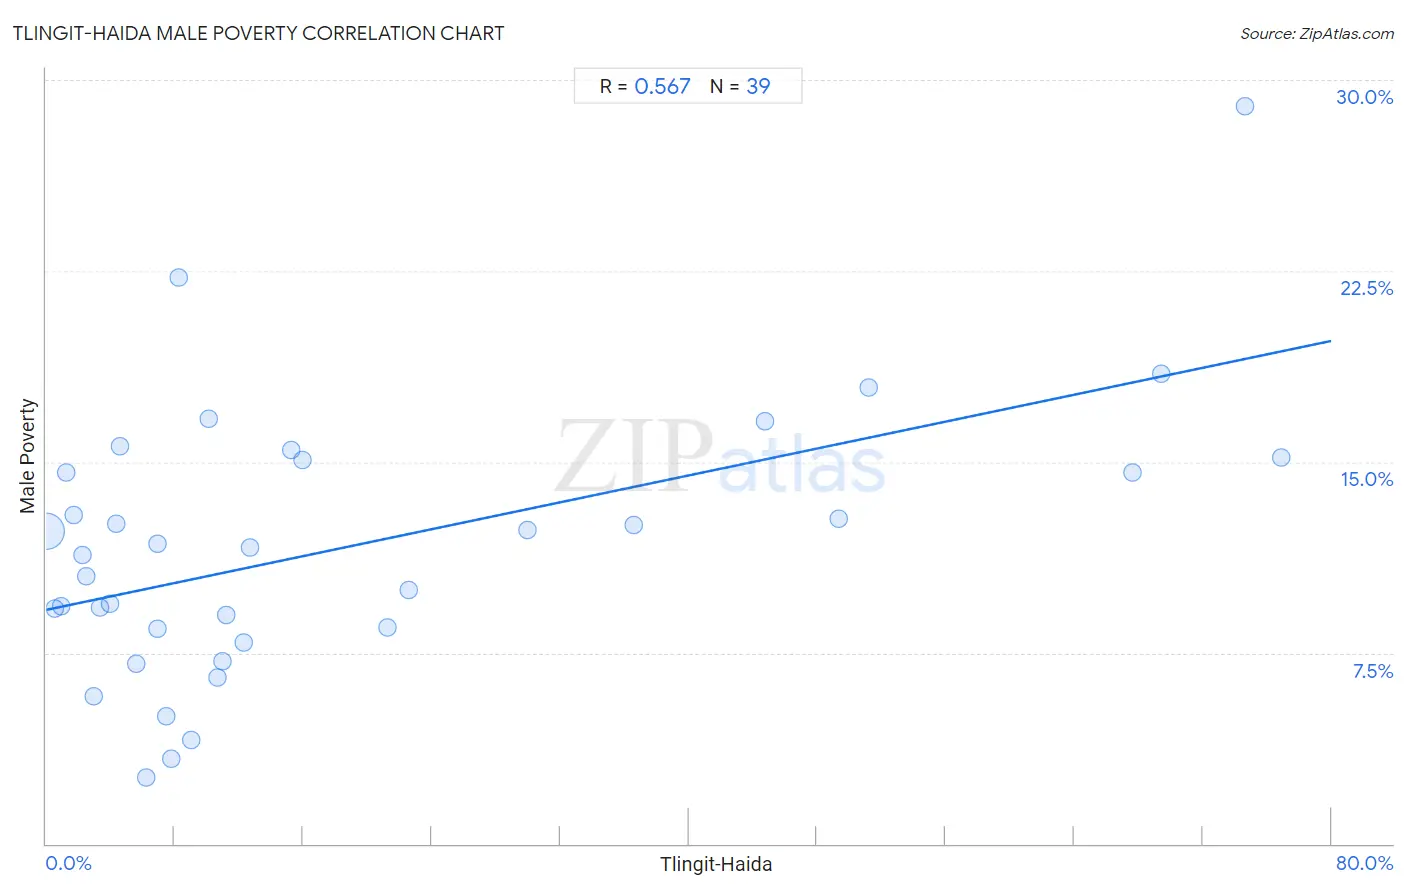
Tlingit-Haida Male Poverty Correlation Chart

The statistical analysis conducted on geographies consisting of 60,854,564 people shows a substantial positive correlation between the proportion of Tlingit-Haida and poverty level among males in the United States with a correlation coefficient (R) of 0.567 and weighted average of 10.9%. On average, for every 1% (one percent) increase in Tlingit-Haida within a typical geography, there is an increase of 0.13% in poverty level among males.
Tlingit-Haida Male Poverty
It is essential to understand that the correlation between the percentage of Tlingit-Haida and poverty level among males does not imply a direct cause-and-effect relationship. It remains uncertain whether the presence of Tlingit-Haida influences an upward or downward trend in the level of poverty level among males within an area, or if Tlingit-Haida simply ended up residing in those areas with higher or lower levels of poverty level among males due to other factors.

Demographics Similar to Tlingit-Haida by Male Poverty

In terms of male poverty, the demographic groups most similar to Tlingit-Haida are Immigrants from France (10.9%, a difference of 0.030%), Immigrants from Jordan (10.8%, a difference of 0.19%), Basque (10.9%, a difference of 0.20%), Yugoslavian (10.8%, a difference of 0.31%), and Immigrants from Switzerland (10.8%, a difference of 0.46%).
DemographicsRating | RankMale Poverty
Pakistanis
83.0
/100
|
#133
Excellent
10.8%
New Zealanders
82.9
/100
|
#134
Excellent
10.8%
Brazilians
82.7
/100
|
#135
Excellent
10.8%
Immigrants from Israel
80.9
/100
|
#136
Excellent
10.8%
Immigrants from Switzerland
79.2
/100
|
#137
Good
10.8%
Yugoslavians
78.2
/100
|
#138
Good
10.8%
Immigrants from Jordan
77.5
/100
|
#139
Good
10.8%
Tlingit-Haida
76.1
/100
|
#140
Good
10.9%
Immigrants from France
75.8
/100
|
#141
Good
10.9%
Basques
74.6
/100
|
#142
Good
10.9%
Afghans
71.9
/100
|
#143
Good
10.9%
Samoans
71.8
/100
|
#144
Good
10.9%
Immigrants from Germany
71.6
/100
|
#145
Good
10.9%
Syrians
71.4
/100
|
#146
Good
10.9%
Icelanders
68.5
/100
|
#147
Good
11.0%

Tlingit-Haida Male Poverty Correlation Summary

MeasurementTlingit-Haida DataMale Poverty Data
Minimum0.036%2.6%
Maximum76.8%28.9%
Range76.8%26.3%
Mean18.7%11.7%
Median9.0%11.6%
Interquartile 25% (IQ1)4.0%8.5%
Interquartile 75% (IQ3)22.6%15.1%
Interquartile Range (IQR)18.6%6.6%
Standard Deviation (Sample)22.5%5.2%
Standard Deviation (Population)22.2%5.2%

Correlation Details

Tlingit-Haida PercentileSample SizeMale Poverty
[
0.0%
-
0.5%
]
0.036%
59,016,73512.3%
[
0.5%
-
1.0%
]
0.54%
1,312,3399.2%
[
0.5%
-
1.0%
]
0.91%
247,8189.3%
[
1.0%
-
1.5%
]
1.24%
85,68714.6%
[
1.5%
-
2.0%
]
1.71%
25,68512.9%
[
2.0%
-
2.5%
]
2.28%
8,44711.4%
[
2.0%
-
2.5%
]
2.46%
3,65510.5%
[
2.5%
-
3.0%
]
2.92%
6,2315.8%
[
3.0%
-
3.5%
]
3.33%
10,3889.3%
[
3.5%
-
4.0%
]
3.97%
1,9649.4%
[
4.0%
-
4.5%
]
4.35%
11512.6%
[
4.5%
-
5.0%
]
4.62%
82215.6%
[
5.5%
-
6.0%
]
5.62%
1,7627.1%
[
6.0%
-
6.5%
]
6.21%
1772.6%
[
6.5%
-
7.0%
]
6.91%
56411.8%
[
6.5%
-
7.0%
]
6.94%
2,1468.5%
[
7.0%
-
7.5%
]
7.50%
405.0%
[
7.5%
-
8.0%
]
7.80%
1,2573.3%
[
8.0%
-
8.5%
]
8.22%
14622.2%
[
8.5%
-
9.0%
]
9.00%
6,6914.1%
[
10.0%
-
10.5%
]
10.13%
2,90216.7%
[
10.5%
-
11.0%
]
10.70%
29,9336.6%
[
11.0%
-
11.5%
]
11.00%
32,1087.2%
[
11.0%
-
11.5%
]
11.18%
13,9139.0%
[
12.0%
-
12.5%
]
12.26%
18,0417.9%
[
12.5%
-
13.0%
]
12.67%
8,16811.6%
[
15.0%
-
15.5%
]
15.26%
2,16915.5%
[
15.5%
-
16.0%
]
15.92%
1,72715.1%
[
21.0%
-
21.5%
]
21.23%
4,2678.5%
[
22.5%
-
23.0%
]
22.55%
1,07310.0%
[
29.5%
-
30.0%
]
29.96%
1,12812.3%
[
36.5%
-
37.0%
]
36.59%
8212.5%
[
44.5%
-
45.0%
]
44.78%
92016.6%
[
49.0%
-
49.5%
]
49.33%
1,79212.7%
[
51.0%
-
51.5%
]
51.24%
80417.9%
[
67.5%
-
68.0%
]
67.59%
36114.6%
[
69.0%
-
69.5%
]
69.41%
1,60218.5%
[
74.5%
-
75.0%
]
74.63%
6728.9%
[
76.5%
-
77.0%
]
76.85%
83815.2%