Japanese Disability Age 5 to 17

COMPARE

Japanese
Race
Ancestry
AfghanAfricanAlaska NativeAlaskan AthabascanAlbanianAleutAlsatianAmericanApacheArabArapahoArgentineanArmenianAssyrian/Chaldean/SyriacAustralianAustrianBahamianBangladeshiBarbadianBasqueBelgianBelizeanBermudanBhutaneseBlackfeetBolivianBrazilianBritishBritish West IndianBulgarianBurmeseCajunCambodianCanadianCape VerdeanCarpatho RusynCelticCentral AmericanCentral American IndianCherokeeCheyenneChickasawChileanChineseChippewaChoctawColombianColvilleComancheCosta RicanCreeCreekCroatianCrowCubanCypriotCzechCzechoslovakianDanishDelawareDominicanDutchDutch West IndianEastern EuropeanEcuadorianEgyptianEnglishEstonianEthiopianEuropeanFijianFilipinoFinnishFrenchFrench American IndianFrench CanadianGermanGerman RussianGhanaianGreekGuamanian/ChamorroGuatemalanGuyaneseHaitianHmongHonduranHopiHoumaHungarianIcelanderIndian (Asian)IndonesianInupiatIranianIraqiIrishIroquoisIsraeliItalianJamaicanJapaneseJordanianKenyanKiowaKoreanLaotianLatvianLebaneseLiberianLithuanianLumbeeLuxembourgerMacedonianMalaysianMalteseMarshalleseMenomineeMexicanMexican American IndianMongolianMoroccanNative HawaiianNavajoNepaleseNew ZealanderNicaraguanNigerianNorthern EuropeanNorwegianOkinawanOsageOttawaPaiutePakistaniPalestinianPanamanianParaguayanPennsylvania GermanPeruvianPimaPolishPortuguesePotawatomiPuebloPuerto RicanPuget Sound SalishRomanianRussianSalvadoranSamoanScandinavianScotch-IrishScottishSeminoleSenegaleseSerbianShoshoneSierra LeoneanSiouxSlavicSlovakSloveneSomaliSouth AfricanSouth AmericanSouth American IndianSoviet UnionSpaniardSpanishSpanish AmericanSpanish American IndianSri LankanSubsaharan AfricanSudaneseSwedishSwissSyrianTaiwaneseThaiTlingit-HaidaTohono O'OdhamTonganTrinidadian and TobagonianTsimshianTurkishU.S. Virgin IslanderUgandanUkrainianUruguayanUteVenezuelanVietnameseWelshWest IndianYakamaYaquiYugoslavianYumanYup'ikZimbabwean
Immigration
NonimmigrantsImmigrantsAfghanistanAfricaAlbaniaArgentinaArmeniaAsiaAustraliaAustriaBahamasBangladeshBarbadosBelarusBelgiumBelizeBoliviaBosnia and HerzegovinaBrazilBulgariaBurma/MyanmarCabo VerdeCambodiaCameroonCanadaCaribbeanCentral AmericaChileChinaColombiaCongoCosta RicaCroatiaCubaCzechoslovakiaDenmarkDominicaDominican RepublicEastern AfricaEastern AsiaEastern EuropeEcuadorEgyptEl SalvadorEnglandEritreaEthiopiaEuropeFijiFranceGermanyGhanaGreeceGrenadaGuatemalaGuyanaHaitiHondurasHong KongHungaryIndiaIndonesiaIranIraqIrelandIsraelItalyJamaicaJapanJordanKazakhstanKenyaKoreaKuwaitLaosLatin AmericaLatviaLebanonLiberiaLithuaniaMalaysiaMexicoMicronesiaMiddle AfricaMoldovaMoroccoNepalNetherlandsNicaraguaNigeriaNorth AmericaNorth MacedoniaNorthern AfricaNorthern EuropeNorwayOceaniaPakistanPanamaPeruPhilippinesPolandPortugalRomaniaRussiaSaudi ArabiaScotlandSenegalSerbiaSierra LeoneSingaporeSomaliaSouth AfricaSouth AmericaSouth Central AsiaSouth Eastern AsiaSouthern EuropeSpainSri LankaSt. Vincent and the GrenadinesSudanSwedenSwitzerlandSyriaTaiwanThailandTrinidad and TobagoTurkeyUgandaUkraineUruguayUzbekistanVenezuelaVietnamWest IndiesWestern AfricaWestern AsiaWestern EuropeYemenZaireZimbabweAzores
Select to Compare
Race
Ancestry
AfghanAfricanAlaska NativeAlaskan AthabascanAlbanianAleutAlsatianAmericanApacheArabArapahoArgentineanArmenianAssyrian/Chaldean/SyriacAustralianAustrianBahamianBangladeshiBarbadianBasqueBelgianBelizeanBermudanBhutaneseBlackfeetBolivianBrazilianBritishBritish West IndianBulgarianBurmeseCajunCambodianCanadianCape VerdeanCarpatho RusynCelticCentral AmericanCentral American IndianCherokeeCheyenneChickasawChileanChineseChippewaChoctawColombianColvilleComancheCosta RicanCreeCreekCroatianCrowCubanCypriotCzechCzechoslovakianDanishDelawareDominicanDutchDutch West IndianEastern EuropeanEcuadorianEgyptianEnglishEstonianEthiopianEuropeanFijianFilipinoFinnishFrenchFrench American IndianFrench CanadianGermanGerman RussianGhanaianGreekGuamanian/ChamorroGuatemalanGuyaneseHaitianHmongHonduranHopiHoumaHungarianIcelanderIndian (Asian)IndonesianInupiatIranianIraqiIrishIroquoisIsraeliItalianJamaicanJordanianKenyanKiowaKoreanLaotianLatvianLebaneseLiberianLithuanianLumbeeLuxembourgerMacedonianMalaysianMalteseMarshalleseMenomineeMexicanMexican American IndianMongolianMoroccanNative HawaiianNavajoNepaleseNew ZealanderNicaraguanNigerianNorthern EuropeanNorwegianOkinawanOsageOttawaPaiutePakistaniPalestinianPanamanianParaguayanPennsylvania GermanPeruvianPimaPolishPortuguesePotawatomiPuebloPuerto RicanPuget Sound SalishRomanianRussianSalvadoranSamoanScandinavianScotch-IrishScottishSeminoleSenegaleseSerbianShoshoneSierra LeoneanSiouxSlavicSlovakSloveneSomaliSouth AfricanSouth AmericanSouth American IndianSoviet UnionSpaniardSpanishSpanish AmericanSpanish American IndianSri LankanSubsaharan AfricanSudaneseSwedishSwissSyrianTaiwaneseThaiTlingit-HaidaTohono O'OdhamTonganTrinidadian and TobagonianTsimshianTurkishU.S. Virgin IslanderUgandanUkrainianUruguayanUteVenezuelanVietnameseWelshWest IndianYakamaYaquiYugoslavianYumanYup'ikZimbabwean
Immigration
NonimmigrantsImmigrantsAfghanistanAfricaAlbaniaArgentinaArmeniaAsiaAustraliaAustriaBahamasBangladeshBarbadosBelarusBelgiumBelizeBoliviaBosnia and HerzegovinaBrazilBulgariaBurma/MyanmarCabo VerdeCambodiaCameroonCanadaCaribbeanCentral AmericaChileChinaColombiaCongoCosta RicaCroatiaCubaCzechoslovakiaDenmarkDominicaDominican RepublicEastern AfricaEastern AsiaEastern EuropeEcuadorEgyptEl SalvadorEnglandEritreaEthiopiaEuropeFijiFranceGermanyGhanaGreeceGrenadaGuatemalaGuyanaHaitiHondurasHong KongHungaryIndiaIndonesiaIranIraqIrelandIsraelItalyJamaicaJapanJordanKazakhstanKenyaKoreaKuwaitLaosLatin AmericaLatviaLebanonLiberiaLithuaniaMalaysiaMexicoMicronesiaMiddle AfricaMoldovaMoroccoNepalNetherlandsNicaraguaNigeriaNorth AmericaNorth MacedoniaNorthern AfricaNorthern EuropeNorwayOceaniaPakistanPanamaPeruPhilippinesPolandPortugalRomaniaRussiaSaudi ArabiaScotlandSenegalSerbiaSierra LeoneSingaporeSomaliaSouth AfricaSouth AmericaSouth Central AsiaSouth Eastern AsiaSouthern EuropeSpainSri LankaSt. Vincent and the GrenadinesSudanSwedenSwitzerlandSyriaTaiwanThailandTrinidad and TobagoTurkeyUgandaUkraineUruguayUzbekistanVenezuelaVietnamWest IndiesWestern AfricaWestern AsiaWestern EuropeYemenZaireZimbabweAzores
Disability Age 5 to 17
Income
Poverty
Unemployment
Labor Participation
Family Structure
Vehicle Availability
Education Level
Disability

Japanese Disability Age 5 to 17
Tragic

6.1%
DISABILITY | AGE 5 TO 17
0.1/ 100
METRIC RATING
276th/ 347
METRIC RANK

Japanese Disability Age 5 to 17 Correlation Chart

The statistical analysis conducted on geographies consisting of 248,392,506 people shows a substantial positive correlation between the proportion of Japanese and percentage of population with a disability between the ages 5 and 17 in the United States with a correlation coefficient (R) of 0.526 and weighted average of 6.1%. On average, for every 1% (one percent) increase in Japanese within a typical geography, there is an increase of 0.27% in percentage of population with a disability between the ages 5 and 17.
Japanese Disability Age 5 to 17
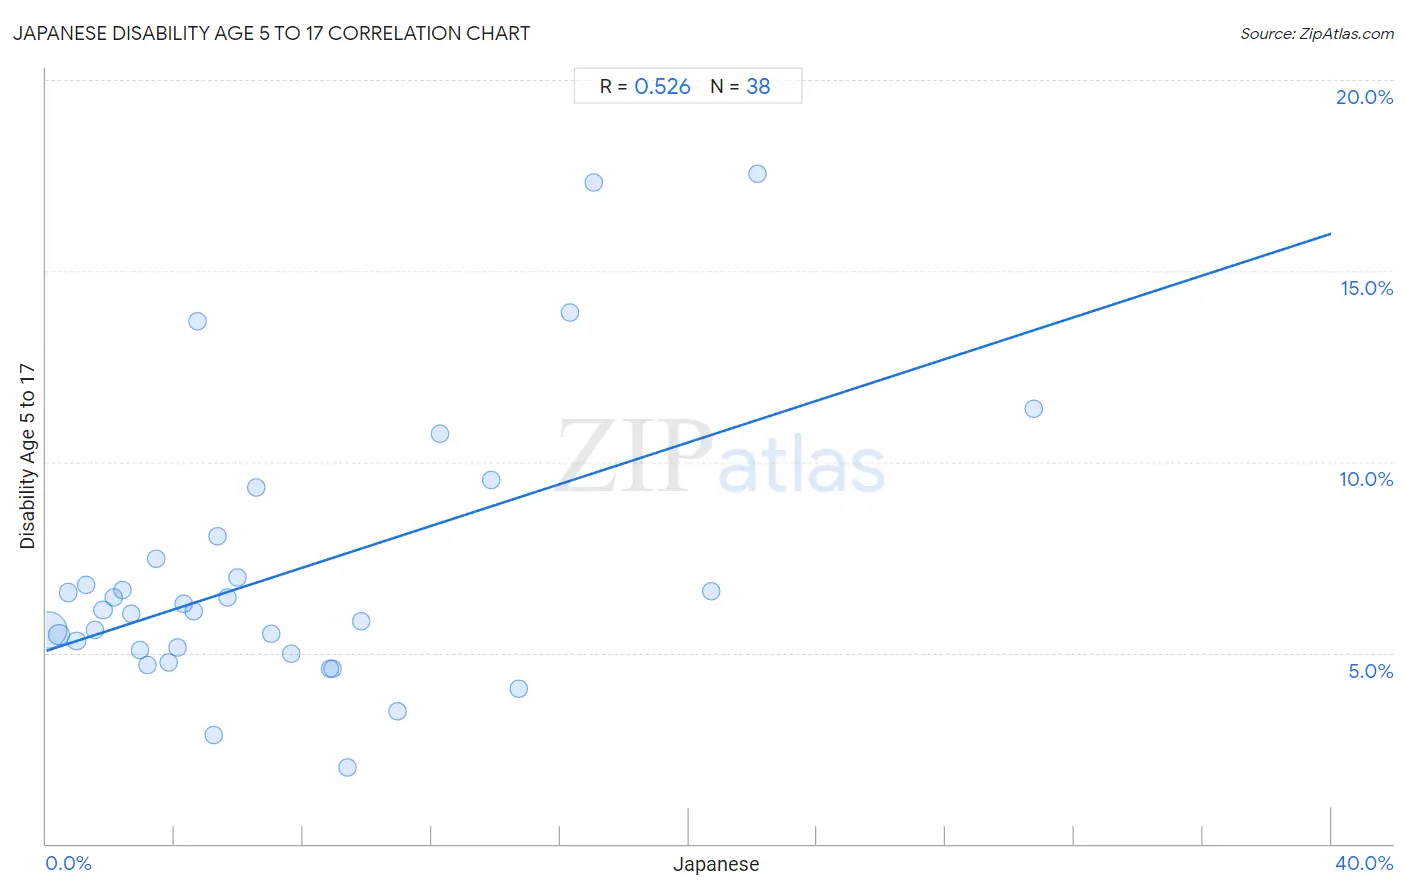
It is essential to understand that the correlation between the percentage of Japanese and percentage of population with a disability between the ages 5 and 17 does not imply a direct cause-and-effect relationship. It remains uncertain whether the presence of Japanese influences an upward or downward trend in the level of percentage of population with a disability between the ages 5 and 17 within an area, or if Japanese simply ended up residing in those areas with higher or lower levels of percentage of population with a disability between the ages 5 and 17 due to other factors.

Demographics Similar to Japanese by Disability Age 5 to 17

In terms of disability age 5 to 17, the demographic groups most similar to Japanese are Dutch (6.0%, a difference of 0.11%), Cheyenne (6.0%, a difference of 0.21%), Alaska Native (6.0%, a difference of 0.33%), Finnish (6.0%, a difference of 0.38%), and Immigrants from Zaire (6.0%, a difference of 0.40%).
DemographicsRating | RankDisability Age 5 to 17
Liberians
0.4
/100
|
#269
Tragic
6.0%
Immigrants from Somalia
0.4
/100
|
#270
Tragic
6.0%
Immigrants from Zaire
0.2
/100
|
#271
Tragic
6.0%
Finns
0.2
/100
|
#272
Tragic
6.0%
Alaska Natives
0.2
/100
|
#273
Tragic
6.0%
Cheyenne
0.2
/100
|
#274
Tragic
6.0%
Dutch
0.2
/100
|
#275
Tragic
6.0%
Japanese
0.1
/100
|
#276
Tragic
6.1%
Puget Sound Salish
0.1
/100
|
#277
Tragic
6.1%
Immigrants from Liberia
0.1
/100
|
#278
Tragic
6.1%
Immigrants from Jamaica
0.1
/100
|
#279
Tragic
6.1%
Portuguese
0.1
/100
|
#280
Tragic
6.1%
Scottish
0.0
/100
|
#281
Tragic
6.1%
Germans
0.0
/100
|
#282
Tragic
6.1%
Ugandans
0.0
/100
|
#283
Tragic
6.2%

Japanese Disability Age 5 to 17 Correlation Summary

MeasurementJapanese DataDisability Age 5 to 17 Data
Minimum0.089%2.0%
Maximum30.7%17.6%
Range30.6%15.6%
Mean7.5%7.1%
Median5.3%6.1%
Interquartile 25% (IQ1)2.6%5.1%
Interquartile 75% (IQ3)9.8%7.5%
Interquartile Range (IQR)7.2%2.4%
Standard Deviation (Sample)6.9%3.6%
Standard Deviation (Population)6.8%3.5%

Correlation Details

Japanese PercentileSample SizeDisability Age 5 to 17
[
0.0%
-
0.5%
]
0.089%
190,763,3815.6%
[
0.0%
-
0.5%
]
0.39%
31,950,8195.5%
[
0.5%
-
1.0%
]
0.68%
11,022,6836.6%
[
0.5%
-
1.0%
]
0.95%
5,529,9665.3%
[
1.0%
-
1.5%
]
1.23%
2,851,5026.8%
[
1.5%
-
2.0%
]
1.51%
1,533,2645.6%
[
1.5%
-
2.0%
]
1.77%
1,257,4906.1%
[
2.0%
-
2.5%
]
2.08%
531,1076.5%
[
2.0%
-
2.5%
]
2.37%
386,4156.6%
[
2.5%
-
3.0%
]
2.64%
81,3136.0%
[
2.5%
-
3.0%
]
2.93%
179,5845.1%
[
3.0%
-
3.5%
]
3.14%
203,5444.7%
[
3.0%
-
3.5%
]
3.43%
147,5457.5%
[
3.5%
-
4.0%
]
3.82%
631,4474.7%
[
4.0%
-
4.5%
]
4.08%
53,3985.1%
[
4.0%
-
4.5%
]
4.30%
473,8826.3%
[
4.5%
-
5.0%
]
4.57%
68,0086.1%
[
4.5%
-
5.0%
]
4.72%
72,04613.7%
[
5.0%
-
5.5%
]
5.21%
41,2402.9%
[
5.0%
-
5.5%
]
5.32%
2,0508.1%
[
5.5%
-
6.0%
]
5.64%
103,4216.5%
[
5.5%
-
6.0%
]
5.97%
68,0397.0%
[
6.5%
-
7.0%
]
6.54%
65,6089.3%
[
6.5%
-
7.0%
]
6.99%
41,0015.5%
[
7.5%
-
8.0%
]
7.64%
53,6475.0%
[
8.5%
-
9.0%
]
8.85%
11,7644.6%
[
8.5%
-
9.0%
]
8.91%
11,6784.6%
[
9.0%
-
9.5%
]
9.38%
2,9112.0%
[
9.5%
-
10.0%
]
9.81%
59,4605.8%
[
10.5%
-
11.0%
]
10.92%
27,8483.5%
[
12.0%
-
12.5%
]
12.25%
2,58810.7%
[
13.5%
-
14.0%
]
13.86%
114,7379.5%
[
14.5%
-
15.0%
]
14.72%
2,2154.1%
[
16.0%
-
16.5%
]
16.30%
41113.9%
[
17.0%
-
17.5%
]
17.03%
7,11817.3%
[
20.5%
-
21.0%
]
20.70%
1,5756.6%
[
22.0%
-
22.5%
]
22.12%
5,47817.6%
[
30.5%
-
31.0%
]
30.73%
32,32311.4%