Immigrants from Bosnia and Herzegovina Disability Age 5 to 17
COMPARE
Immigrants from Bosnia and Herzegovina
Select to Compare
Disability Age 5 to 17
Immigrants from Bosnia and Herzegovina Disability Age 5 to 17
5.7%
DISABILITY | AGE 5 TO 17
26.3/ 100
METRIC RATING
192nd/ 347
METRIC RANK
Immigrants from Bosnia and Herzegovina Disability Age 5 to 17 Correlation Chart
The statistical analysis conducted on geographies consisting of 156,380,424 people shows a strong positive correlation between the proportion of Immigrants from Bosnia and Herzegovina and percentage of population with a disability between the ages 5 and 17 in the United States with a correlation coefficient (R) of 0.758 and weighted average of 5.7%. On average, for every 1% (one percent) increase in Immigrants from Bosnia and Herzegovina within a typical geography, there is an increase of 1.2% in percentage of population with a disability between the ages 5 and 17.
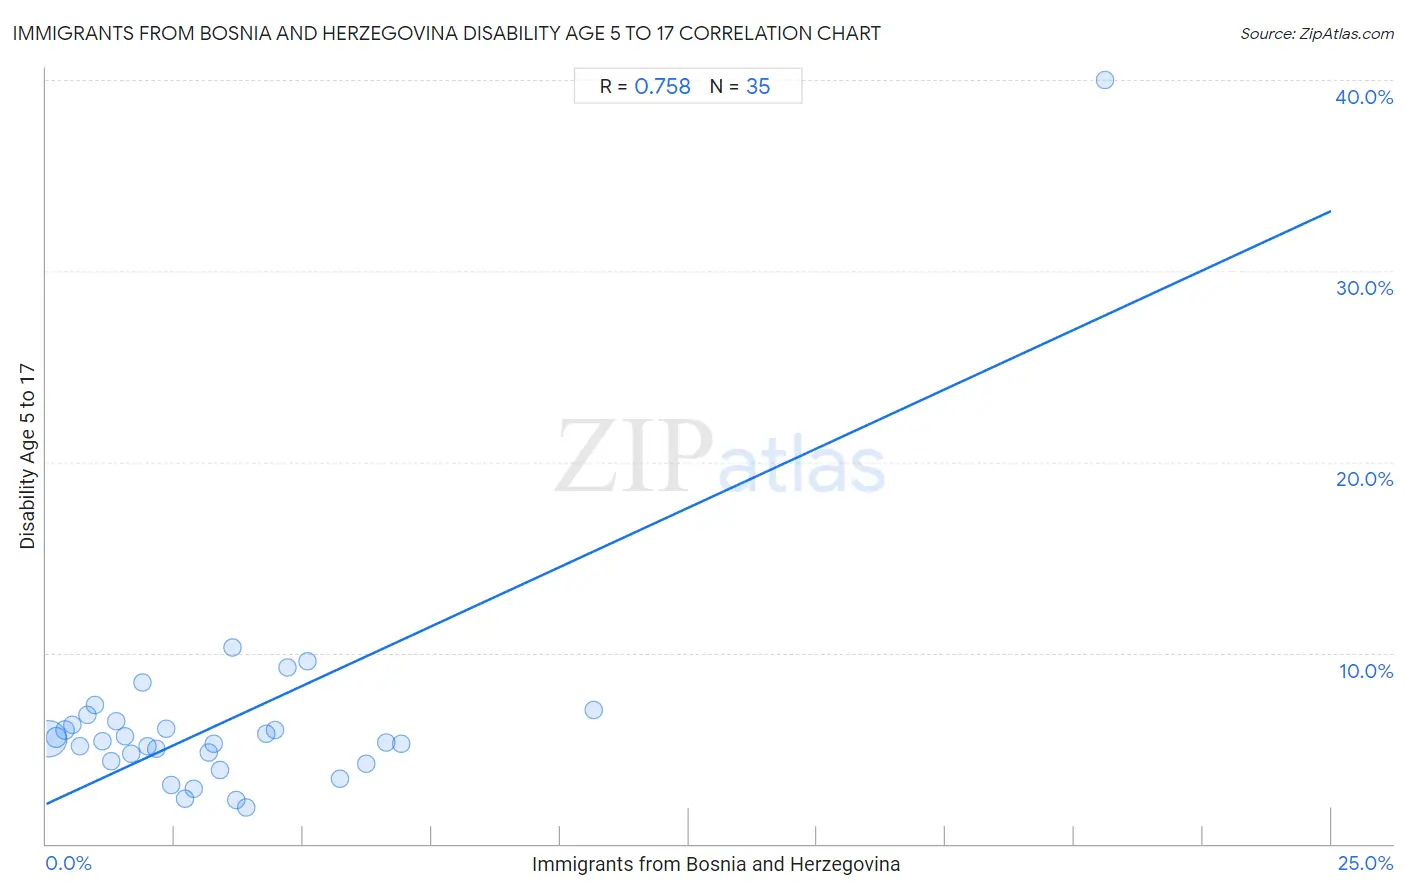
It is essential to understand that the correlation between the percentage of Immigrants from Bosnia and Herzegovina and percentage of population with a disability between the ages 5 and 17 does not imply a direct cause-and-effect relationship. It remains uncertain whether the presence of Immigrants from Bosnia and Herzegovina influences an upward or downward trend in the level of percentage of population with a disability between the ages 5 and 17 within an area, or if Immigrants from Bosnia and Herzegovina simply ended up residing in those areas with higher or lower levels of percentage of population with a disability between the ages 5 and 17 due to other factors.
Demographics Similar to Immigrants from Bosnia and Herzegovina by Disability Age 5 to 17
In terms of disability age 5 to 17, the demographic groups most similar to Immigrants from Bosnia and Herzegovina are Danish (5.7%, a difference of 0.010%), Immigrants from Canada (5.7%, a difference of 0.010%), Immigrants from Eastern Africa (5.7%, a difference of 0.060%), Pueblo (5.7%, a difference of 0.070%), and Marshallese (5.7%, a difference of 0.11%).
| Demographics | Rating | Rank | Disability Age 5 to 17 |
| Immigrants from Mexico | 33.7 /100 | #185 | Fair 5.6% |
| Fijians | 31.7 /100 | #186 | Fair 5.7% |
| Immigrants from Thailand | 30.2 /100 | #187 | Fair 5.7% |
| Marshallese | 28.1 /100 | #188 | Fair 5.7% |
| Pueblo | 27.5 /100 | #189 | Fair 5.7% |
| Immigrants from Eastern Africa | 27.3 /100 | #190 | Fair 5.7% |
| Danes | 26.5 /100 | #191 | Fair 5.7% |
| Immigrants from Bosnia and Herzegovina | 26.3 /100 | #192 | Fair 5.7% |
| Immigrants from Canada | 26.1 /100 | #193 | Fair 5.7% |
| Croatians | 23.6 /100 | #194 | Fair 5.7% |
| Immigrants from Nigeria | 23.4 /100 | #195 | Fair 5.7% |
| Inupiat | 23.3 /100 | #196 | Fair 5.7% |
| Immigrants from North America | 23.1 /100 | #197 | Fair 5.7% |
| Norwegians | 20.9 /100 | #198 | Fair 5.7% |
| Northern Europeans | 15.2 /100 | #199 | Poor 5.7% |
Immigrants from Bosnia and Herzegovina Disability Age 5 to 17 Correlation Summary
| Measurement | Immigrants from Bosnia and Herzegovina Data | Disability Age 5 to 17 Data |
| Minimum | 0.040% | 1.9% |
| Maximum | 20.6% | 40.0% |
| Range | 20.5% | 38.1% |
| Mean | 3.5% | 6.4% |
| Median | 2.7% | 5.3% |
| Interquartile 25% (IQ1) | 1.3% | 4.3% |
| Interquartile 75% (IQ3) | 4.5% | 6.4% |
| Interquartile Range (IQR) | 3.2% | 2.1% |
| Standard Deviation (Sample) | 3.8% | 6.2% |
| Standard Deviation (Population) | 3.7% | 6.1% |
Correlation Details
| Immigrants from Bosnia and Herzegovina Percentile | Sample Size | Disability Age 5 to 17 |
[ 0.0% - 0.5% ] 0.040% | 123,869,823 | 5.5% |
[ 0.0% - 0.5% ] 0.20% | 17,482,995 | 5.6% |
[ 0.0% - 0.5% ] 0.36% | 7,550,359 | 6.0% |
[ 0.5% - 1.0% ] 0.51% | 2,103,448 | 6.2% |
[ 0.5% - 1.0% ] 0.66% | 1,183,133 | 5.1% |
[ 0.5% - 1.0% ] 0.80% | 1,319,299 | 6.7% |
[ 0.5% - 1.0% ] 0.95% | 565,983 | 7.2% |
[ 1.0% - 1.5% ] 1.10% | 354,445 | 5.3% |
[ 1.0% - 1.5% ] 1.26% | 509,697 | 4.3% |
[ 1.0% - 1.5% ] 1.37% | 95,262 | 6.4% |
[ 1.5% - 2.0% ] 1.54% | 174,233 | 5.6% |
[ 1.5% - 2.0% ] 1.66% | 357,559 | 4.7% |
[ 1.5% - 2.0% ] 1.86% | 106,408 | 8.4% |
[ 1.5% - 2.0% ] 1.98% | 104,066 | 5.1% |
[ 2.0% - 2.5% ] 2.14% | 111,101 | 5.0% |
[ 2.0% - 2.5% ] 2.34% | 72,733 | 6.0% |
[ 2.0% - 2.5% ] 2.42% | 36,903 | 3.1% |
[ 2.5% - 3.0% ] 2.71% | 443 | 2.4% |
[ 2.5% - 3.0% ] 2.86% | 8,763 | 2.9% |
[ 3.0% - 3.5% ] 3.16% | 12,587 | 4.8% |
[ 3.0% - 3.5% ] 3.26% | 11,619 | 5.2% |
[ 3.0% - 3.5% ] 3.38% | 50,347 | 3.8% |
[ 3.5% - 4.0% ] 3.62% | 48,317 | 10.3% |
[ 3.5% - 4.0% ] 3.70% | 6,410 | 2.3% |
[ 3.5% - 4.0% ] 3.88% | 19,423 | 1.9% |
[ 4.0% - 4.5% ] 4.28% | 19,922 | 5.7% |
[ 4.0% - 4.5% ] 4.45% | 69,823 | 6.0% |
[ 4.5% - 5.0% ] 4.68% | 2,220 | 9.2% |
[ 5.0% - 5.5% ] 5.09% | 5,345 | 9.5% |
[ 5.5% - 6.0% ] 5.71% | 8,759 | 3.4% |
[ 6.0% - 6.5% ] 6.23% | 45,300 | 4.2% |
[ 6.5% - 7.0% ] 6.62% | 40,152 | 5.3% |
[ 6.5% - 7.0% ] 6.90% | 32,750 | 5.2% |
[ 10.5% - 11.0% ] 10.65% | 695 | 7.0% |
[ 20.5% - 21.0% ] 20.59% | 102 | 40.0% |