British Disability Age 5 to 17
COMPARE
British
Select to Compare
Disability Age 5 to 17
British Disability Age 5 to 17
5.9%
DISABILITY | AGE 5 TO 17
1.7/ 100
METRIC RATING
248th/ 347
METRIC RANK
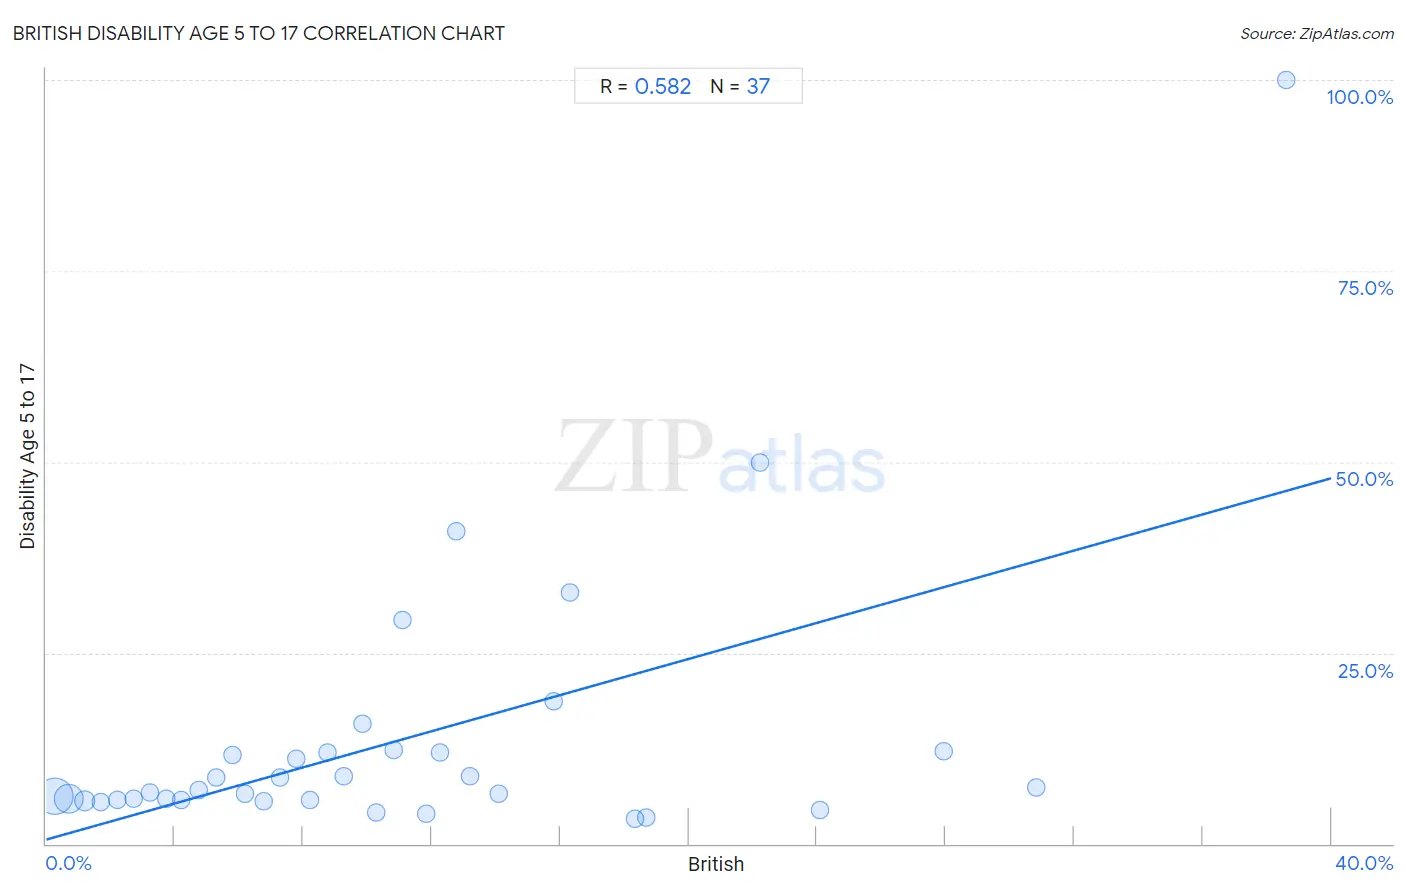
British Disability Age 5 to 17 Correlation Chart
The statistical analysis conducted on geographies consisting of 522,278,318 people shows a substantial positive correlation between the proportion of British and percentage of population with a disability between the ages 5 and 17 in the United States with a correlation coefficient (R) of 0.582 and weighted average of 5.9%. On average, for every 1% (one percent) increase in British within a typical geography, there is an increase of 1.2% in percentage of population with a disability between the ages 5 and 17.
It is essential to understand that the correlation between the percentage of British and percentage of population with a disability between the ages 5 and 17 does not imply a direct cause-and-effect relationship. It remains uncertain whether the presence of British influences an upward or downward trend in the level of percentage of population with a disability between the ages 5 and 17 within an area, or if British simply ended up residing in those areas with higher or lower levels of percentage of population with a disability between the ages 5 and 17 due to other factors.
Demographics Similar to British by Disability Age 5 to 17
In terms of disability age 5 to 17, the demographic groups most similar to British are Immigrants from Ghana (5.9%, a difference of 0.010%), Immigrants from Honduras (5.9%, a difference of 0.070%), Immigrants from Micronesia (5.9%, a difference of 0.10%), Tlingit-Haida (5.9%, a difference of 0.10%), and Immigrants from Germany (5.9%, a difference of 0.11%).
| Demographics | Rating | Rank | Disability Age 5 to 17 |
| Immigrants from Caribbean | 2.1 /100 | #241 | Tragic 5.9% |
| Spaniards | 2.0 /100 | #242 | Tragic 5.9% |
| Indonesians | 2.0 /100 | #243 | Tragic 5.9% |
| Immigrants from Germany | 1.9 /100 | #244 | Tragic 5.9% |
| Immigrants from Micronesia | 1.9 /100 | #245 | Tragic 5.9% |
| Tlingit-Haida | 1.9 /100 | #246 | Tragic 5.9% |
| Immigrants from Honduras | 1.8 /100 | #247 | Tragic 5.9% |
| British | 1.7 /100 | #248 | Tragic 5.9% |
| Immigrants from Ghana | 1.7 /100 | #249 | Tragic 5.9% |
| Poles | 1.5 /100 | #250 | Tragic 5.9% |
| Immigrants from Cambodia | 1.5 /100 | #251 | Tragic 5.9% |
| Hondurans | 1.5 /100 | #252 | Tragic 5.9% |
| Scandinavians | 1.4 /100 | #253 | Tragic 5.9% |
| Barbadians | 1.3 /100 | #254 | Tragic 5.9% |
| Italians | 1.2 /100 | #255 | Tragic 5.9% |
British Disability Age 5 to 17 Correlation Summary
| Measurement | British Data | Disability Age 5 to 17 Data |
| Minimum | 0.26% | 3.2% |
| Maximum | 38.6% | 100.0% |
| Range | 38.3% | 96.8% |
| Mean | 11.1% | 13.6% |
| Median | 9.3% | 7.0% |
| Interquartile 25% (IQ1) | 4.5% | 5.7% |
| Interquartile 75% (IQ3) | 14.9% | 12.0% |
| Interquartile Range (IQR) | 10.5% | 6.2% |
| Standard Deviation (Sample) | 8.8% | 18.0% |
| Standard Deviation (Population) | 8.7% | 17.7% |
Correlation Details
| British Percentile | Sample Size | Disability Age 5 to 17 |
[ 0.0% - 0.5% ] 0.26% | 282,541,726 | 6.2% |
[ 0.5% - 1.0% ] 0.71% | 169,610,431 | 5.8% |
[ 1.0% - 1.5% ] 1.20% | 48,399,549 | 5.6% |
[ 1.5% - 2.0% ] 1.70% | 13,286,275 | 5.5% |
[ 2.0% - 2.5% ] 2.22% | 4,617,130 | 5.8% |
[ 2.5% - 3.0% ] 2.73% | 1,874,248 | 5.9% |
[ 3.0% - 3.5% ] 3.23% | 654,881 | 6.7% |
[ 3.5% - 4.0% ] 3.74% | 577,815 | 5.8% |
[ 4.0% - 4.5% ] 4.19% | 317,522 | 5.7% |
[ 4.5% - 5.0% ] 4.73% | 106,865 | 7.0% |
[ 5.0% - 5.5% ] 5.30% | 55,185 | 8.7% |
[ 5.5% - 6.0% ] 5.79% | 38,518 | 11.6% |
[ 6.0% - 6.5% ] 6.19% | 26,622 | 6.5% |
[ 6.5% - 7.0% ] 6.76% | 34,033 | 5.5% |
[ 7.0% - 7.5% ] 7.28% | 30,879 | 8.6% |
[ 7.5% - 8.0% ] 7.79% | 22,467 | 11.2% |
[ 8.0% - 8.5% ] 8.19% | 34,172 | 5.8% |
[ 8.5% - 9.0% ] 8.77% | 10,056 | 11.9% |
[ 9.0% - 9.5% ] 9.26% | 5,799 | 8.9% |
[ 9.5% - 10.0% ] 9.84% | 976 | 15.7% |
[ 10.0% - 10.5% ] 10.27% | 8,295 | 4.1% |
[ 10.5% - 11.0% ] 10.83% | 5,816 | 12.2% |
[ 11.0% - 11.5% ] 11.07% | 1,436 | 29.2% |
[ 11.5% - 12.0% ] 11.85% | 3,199 | 3.9% |
[ 12.0% - 12.5% ] 12.26% | 1,533 | 11.9% |
[ 12.5% - 13.0% ] 12.77% | 274 | 40.9% |
[ 13.0% - 13.5% ] 13.20% | 3,583 | 8.9% |
[ 14.0% - 14.5% ] 14.09% | 1,583 | 6.5% |
[ 15.5% - 16.0% ] 15.81% | 1,221 | 18.6% |
[ 16.0% - 16.5% ] 16.29% | 3,659 | 32.9% |
[ 18.0% - 18.5% ] 18.32% | 644 | 3.2% |
[ 18.5% - 19.0% ] 18.66% | 568 | 3.5% |
[ 22.0% - 22.5% ] 22.22% | 234 | 50.0% |
[ 24.0% - 24.5% ] 24.09% | 137 | 4.3% |
[ 27.5% - 28.0% ] 27.92% | 745 | 12.0% |
[ 30.5% - 31.0% ] 30.81% | 185 | 7.4% |
[ 38.5% - 39.0% ] 38.60% | 57 | 100.0% |