Lebanese Disability Age 5 to 17
COMPARE
Lebanese
Select to Compare
Disability Age 5 to 17
Lebanese Disability Age 5 to 17
5.6%
DISABILITY | AGE 5 TO 17
61.4/ 100
METRIC RATING
165th/ 347
METRIC RANK
Lebanese Disability Age 5 to 17 Correlation Chart
The statistical analysis conducted on geographies consisting of 398,034,375 people shows a strong positive correlation between the proportion of Lebanese and percentage of population with a disability between the ages 5 and 17 in the United States with a correlation coefficient (R) of 0.769 and weighted average of 5.6%. On average, for every 1% (one percent) increase in Lebanese within a typical geography, there is an increase of 0.95% in percentage of population with a disability between the ages 5 and 17.
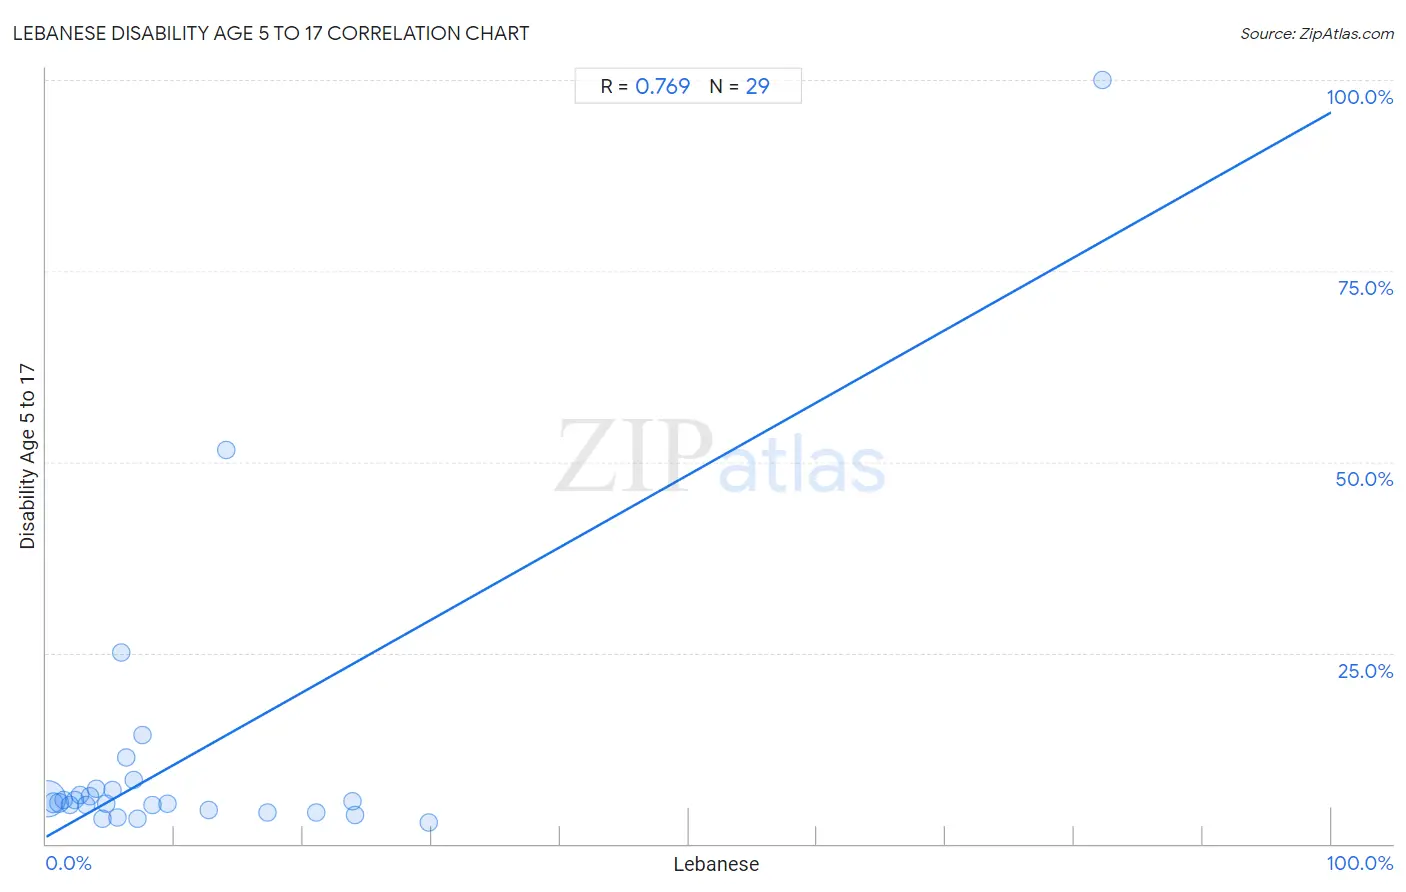
It is essential to understand that the correlation between the percentage of Lebanese and percentage of population with a disability between the ages 5 and 17 does not imply a direct cause-and-effect relationship. It remains uncertain whether the presence of Lebanese influences an upward or downward trend in the level of percentage of population with a disability between the ages 5 and 17 within an area, or if Lebanese simply ended up residing in those areas with higher or lower levels of percentage of population with a disability between the ages 5 and 17 due to other factors.
Demographics Similar to Lebanese by Disability Age 5 to 17
In terms of disability age 5 to 17, the demographic groups most similar to Lebanese are Immigrants from Scotland (5.6%, a difference of 0.030%), Greek (5.6%, a difference of 0.040%), Immigrants from Burma/Myanmar (5.6%, a difference of 0.11%), Immigrants from Southern Europe (5.6%, a difference of 0.14%), and Iraqi (5.6%, a difference of 0.27%).
| Demographics | Rating | Rank | Disability Age 5 to 17 |
| Immigrants from Nepal | 77.1 /100 | #158 | Good 5.5% |
| Immigrants from Zimbabwe | 75.3 /100 | #159 | Good 5.5% |
| South Africans | 73.3 /100 | #160 | Good 5.5% |
| Immigrants from Saudi Arabia | 69.1 /100 | #161 | Good 5.5% |
| Zimbabweans | 67.2 /100 | #162 | Good 5.5% |
| Immigrants from Southern Europe | 64.0 /100 | #163 | Good 5.6% |
| Immigrants from Scotland | 61.9 /100 | #164 | Good 5.6% |
| Lebanese | 61.4 /100 | #165 | Good 5.6% |
| Greeks | 60.6 /100 | #166 | Good 5.6% |
| Immigrants from Burma/Myanmar | 59.3 /100 | #167 | Average 5.6% |
| Iraqis | 56.0 /100 | #168 | Average 5.6% |
| Immigrants from Norway | 55.7 /100 | #169 | Average 5.6% |
| Serbians | 54.0 /100 | #170 | Average 5.6% |
| Immigrants from Iraq | 53.9 /100 | #171 | Average 5.6% |
| Ukrainians | 51.5 /100 | #172 | Average 5.6% |
Lebanese Disability Age 5 to 17 Correlation Summary
| Measurement | Lebanese Data | Disability Age 5 to 17 Data |
| Minimum | 0.14% | 2.9% |
| Maximum | 82.2% | 100.0% |
| Range | 82.1% | 97.1% |
| Mean | 10.9% | 11.2% |
| Median | 5.9% | 5.4% |
| Interquartile 25% (IQ1) | 2.9% | 4.3% |
| Interquartile 75% (IQ3) | 13.3% | 7.1% |
| Interquartile Range (IQR) | 10.5% | 2.8% |
| Standard Deviation (Sample) | 15.8% | 19.5% |
| Standard Deviation (Population) | 15.5% | 19.1% |
Correlation Details
| Lebanese Percentile | Sample Size | Disability Age 5 to 17 |
[ 0.0% - 0.5% ] 0.14% | 346,420,180 | 5.8% |
[ 0.5% - 1.0% ] 0.55% | 36,953,878 | 5.4% |
[ 0.5% - 1.0% ] 0.99% | 8,526,288 | 5.3% |
[ 1.0% - 1.5% ] 1.39% | 3,267,410 | 5.8% |
[ 1.5% - 2.0% ] 1.84% | 1,145,739 | 5.1% |
[ 2.0% - 2.5% ] 2.20% | 590,530 | 5.8% |
[ 2.5% - 3.0% ] 2.60% | 384,593 | 6.4% |
[ 3.0% - 3.5% ] 3.10% | 152,479 | 5.1% |
[ 3.0% - 3.5% ] 3.42% | 78,151 | 6.3% |
[ 3.5% - 4.0% ] 3.90% | 124,643 | 7.2% |
[ 4.0% - 4.5% ] 4.36% | 10,513 | 3.4% |
[ 4.5% - 5.0% ] 4.68% | 14,516 | 5.3% |
[ 5.0% - 5.5% ] 5.16% | 31,368 | 7.0% |
[ 5.5% - 6.0% ] 5.55% | 6,253 | 3.4% |
[ 5.5% - 6.0% ] 5.88% | 119 | 25.0% |
[ 6.0% - 6.5% ] 6.25% | 224 | 11.2% |
[ 6.5% - 7.0% ] 6.85% | 4,806 | 8.4% |
[ 7.0% - 7.5% ] 7.08% | 7,444 | 3.3% |
[ 7.5% - 8.0% ] 7.52% | 1,277 | 14.2% |
[ 8.0% - 8.5% ] 8.31% | 34,371 | 5.1% |
[ 9.0% - 9.5% ] 9.47% | 169 | 5.3% |
[ 12.5% - 13.0% ] 12.67% | 2,359 | 4.4% |
[ 13.5% - 14.0% ] 13.97% | 229 | 51.5% |
[ 17.0% - 17.5% ] 17.21% | 108,414 | 4.1% |
[ 21.0% - 21.5% ] 21.06% | 62,474 | 4.2% |
[ 23.5% - 24.0% ] 23.82% | 12,405 | 5.6% |
[ 24.0% - 24.5% ] 24.07% | 53,044 | 3.8% |
[ 29.5% - 30.0% ] 29.74% | 40,392 | 2.9% |
[ 82.0% - 82.5% ] 82.24% | 107 | 100.0% |