Immigrants from Ghana Disability Age 5 to 17
COMPARE
Immigrants from Ghana
Select to Compare
Disability Age 5 to 17
Immigrants from Ghana Disability Age 5 to 17
5.9%
DISABILITY | AGE 5 TO 17
1.7/ 100
METRIC RATING
249th/ 347
METRIC RANK
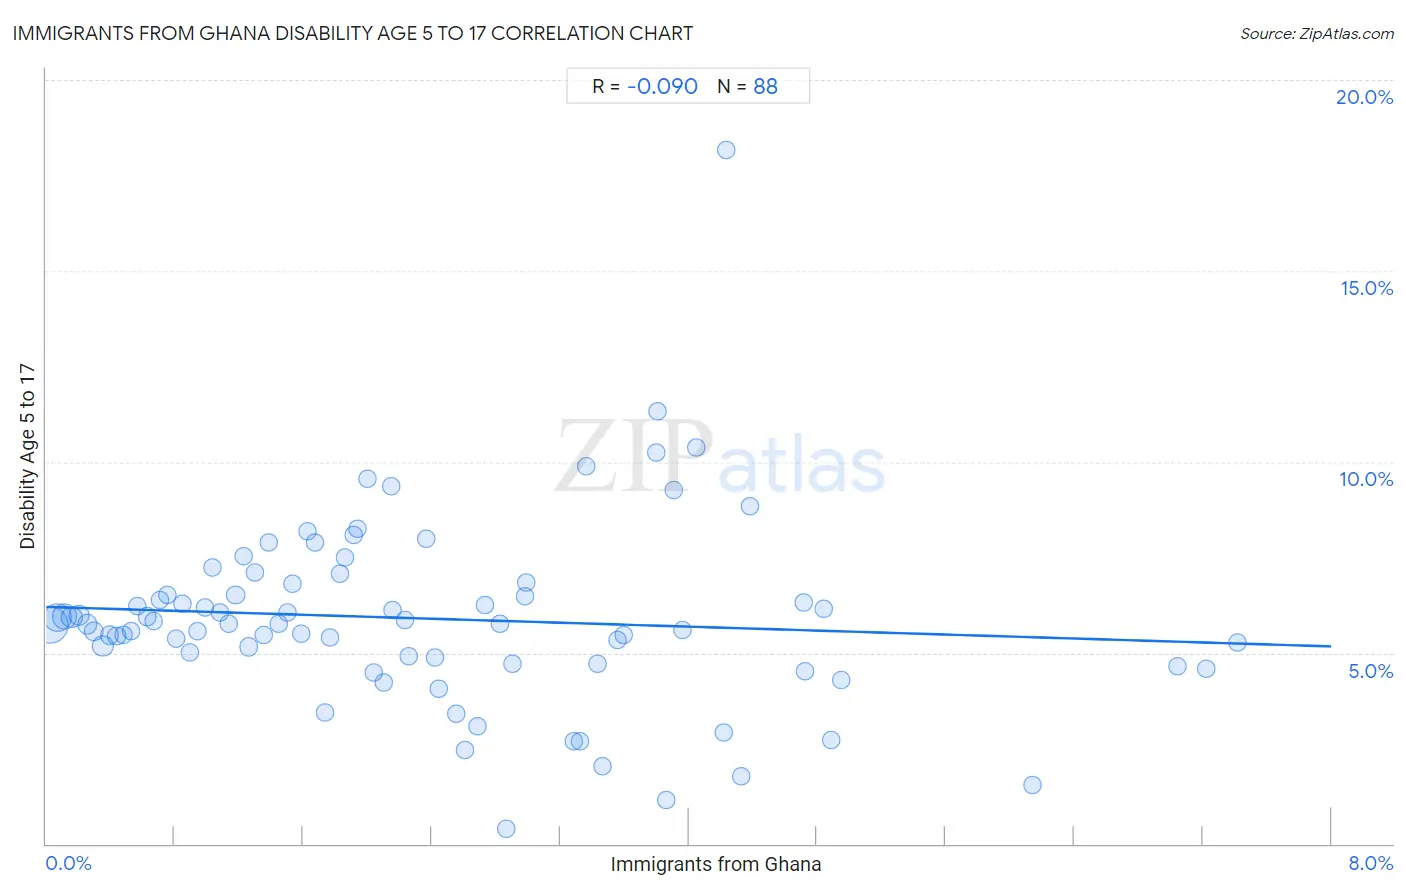
Immigrants from Ghana Disability Age 5 to 17 Correlation Chart
The statistical analysis conducted on geographies consisting of 199,220,880 people shows a slight negative correlation between the proportion of Immigrants from Ghana and percentage of population with a disability between the ages 5 and 17 in the United States with a correlation coefficient (R) of -0.090 and weighted average of 5.9%. On average, for every 1% (one percent) increase in Immigrants from Ghana within a typical geography, there is a decrease of 0.13% in percentage of population with a disability between the ages 5 and 17.
It is essential to understand that the correlation between the percentage of Immigrants from Ghana and percentage of population with a disability between the ages 5 and 17 does not imply a direct cause-and-effect relationship. It remains uncertain whether the presence of Immigrants from Ghana influences an upward or downward trend in the level of percentage of population with a disability between the ages 5 and 17 within an area, or if Immigrants from Ghana simply ended up residing in those areas with higher or lower levels of percentage of population with a disability between the ages 5 and 17 due to other factors.
Demographics Similar to Immigrants from Ghana by Disability Age 5 to 17
In terms of disability age 5 to 17, the demographic groups most similar to Immigrants from Ghana are British (5.9%, a difference of 0.010%), Immigrants from Honduras (5.9%, a difference of 0.090%), Immigrants from Germany (5.9%, a difference of 0.12%), Immigrants from Micronesia (5.9%, a difference of 0.12%), and Tlingit-Haida (5.9%, a difference of 0.12%).
| Demographics | Rating | Rank | Disability Age 5 to 17 |
| Spaniards | 2.0 /100 | #242 | Tragic 5.9% |
| Indonesians | 2.0 /100 | #243 | Tragic 5.9% |
| Immigrants from Germany | 1.9 /100 | #244 | Tragic 5.9% |
| Immigrants from Micronesia | 1.9 /100 | #245 | Tragic 5.9% |
| Tlingit-Haida | 1.9 /100 | #246 | Tragic 5.9% |
| Immigrants from Honduras | 1.8 /100 | #247 | Tragic 5.9% |
| British | 1.7 /100 | #248 | Tragic 5.9% |
| Immigrants from Ghana | 1.7 /100 | #249 | Tragic 5.9% |
| Poles | 1.5 /100 | #250 | Tragic 5.9% |
| Immigrants from Cambodia | 1.5 /100 | #251 | Tragic 5.9% |
| Hondurans | 1.5 /100 | #252 | Tragic 5.9% |
| Scandinavians | 1.4 /100 | #253 | Tragic 5.9% |
| Barbadians | 1.3 /100 | #254 | Tragic 5.9% |
| Italians | 1.2 /100 | #255 | Tragic 5.9% |
| Hopi | 1.0 /100 | #256 | Tragic 5.9% |
Immigrants from Ghana Disability Age 5 to 17 Correlation Summary
| Measurement | Immigrants from Ghana Data | Disability Age 5 to 17 Data |
| Minimum | 0.023% | 0.40% |
| Maximum | 7.4% | 18.2% |
| Range | 7.4% | 17.8% |
| Mean | 2.3% | 5.9% |
| Median | 2.0% | 5.8% |
| Interquartile 25% (IQ1) | 1.0% | 4.8% |
| Interquartile 75% (IQ3) | 3.4% | 6.7% |
| Interquartile Range (IQR) | 2.4% | 1.9% |
| Standard Deviation (Sample) | 1.7% | 2.5% |
| Standard Deviation (Population) | 1.7% | 2.4% |
Correlation Details
| Immigrants from Ghana Percentile | Sample Size | Disability Age 5 to 17 |
[ 0.0% - 0.5% ] 0.023% | 71,874,340 | 5.7% |
[ 0.0% - 0.5% ] 0.068% | 38,229,489 | 5.9% |
[ 0.0% - 0.5% ] 0.11% | 27,243,438 | 6.0% |
[ 0.0% - 0.5% ] 0.16% | 10,100,469 | 5.9% |
[ 0.0% - 0.5% ] 0.21% | 7,549,978 | 6.0% |
[ 0.0% - 0.5% ] 0.25% | 6,284,757 | 5.7% |
[ 0.0% - 0.5% ] 0.30% | 4,468,620 | 5.6% |
[ 0.0% - 0.5% ] 0.35% | 11,748,159 | 5.2% |
[ 0.0% - 0.5% ] 0.39% | 3,176,006 | 5.5% |
[ 0.0% - 0.5% ] 0.44% | 1,794,825 | 5.4% |
[ 0.0% - 0.5% ] 0.48% | 1,687,124 | 5.5% |
[ 0.5% - 1.0% ] 0.53% | 1,242,791 | 5.6% |
[ 0.5% - 1.0% ] 0.57% | 1,447,435 | 6.2% |
[ 0.5% - 1.0% ] 0.63% | 1,943,098 | 6.0% |
[ 0.5% - 1.0% ] 0.67% | 1,066,348 | 5.8% |
[ 0.5% - 1.0% ] 0.71% | 508,515 | 6.4% |
[ 0.5% - 1.0% ] 0.75% | 737,997 | 6.5% |
[ 0.5% - 1.0% ] 0.81% | 814,816 | 5.4% |
[ 0.5% - 1.0% ] 0.84% | 478,270 | 6.3% |
[ 0.5% - 1.0% ] 0.89% | 674,190 | 5.0% |
[ 0.5% - 1.0% ] 0.94% | 281,924 | 5.6% |
[ 0.5% - 1.0% ] 0.99% | 521,604 | 6.2% |
[ 1.0% - 1.5% ] 1.03% | 333,427 | 7.2% |
[ 1.0% - 1.5% ] 1.08% | 297,159 | 6.1% |
[ 1.0% - 1.5% ] 1.14% | 258,840 | 5.7% |
[ 1.0% - 1.5% ] 1.18% | 140,128 | 6.5% |
[ 1.0% - 1.5% ] 1.23% | 633,295 | 7.5% |
[ 1.0% - 1.5% ] 1.26% | 327,487 | 5.2% |
[ 1.0% - 1.5% ] 1.30% | 150,381 | 7.1% |
[ 1.0% - 1.5% ] 1.36% | 108,025 | 5.5% |
[ 1.0% - 1.5% ] 1.39% | 160,729 | 7.9% |
[ 1.0% - 1.5% ] 1.45% | 154,911 | 5.8% |
[ 1.0% - 1.5% ] 1.50% | 115,805 | 6.1% |
[ 1.5% - 2.0% ] 1.53% | 140,371 | 6.8% |
[ 1.5% - 2.0% ] 1.58% | 335,914 | 5.5% |
[ 1.5% - 2.0% ] 1.63% | 71,012 | 8.2% |
[ 1.5% - 2.0% ] 1.67% | 63,130 | 7.9% |
[ 1.5% - 2.0% ] 1.73% | 55,782 | 3.4% |
[ 1.5% - 2.0% ] 1.77% | 25,677 | 5.4% |
[ 1.5% - 2.0% ] 1.83% | 27,033 | 7.1% |
[ 1.5% - 2.0% ] 1.86% | 240,968 | 7.5% |
[ 1.5% - 2.0% ] 1.91% | 2,770 | 8.1% |
[ 1.5% - 2.0% ] 1.94% | 160,730 | 8.2% |
[ 2.0% - 2.5% ] 2.00% | 14,531 | 9.6% |
[ 2.0% - 2.5% ] 2.04% | 25,568 | 4.5% |
[ 2.0% - 2.5% ] 2.10% | 60,268 | 4.2% |
[ 2.0% - 2.5% ] 2.14% | 97,226 | 9.4% |
[ 2.0% - 2.5% ] 2.16% | 24,158 | 6.1% |
[ 2.0% - 2.5% ] 2.24% | 76,720 | 5.9% |
[ 2.0% - 2.5% ] 2.26% | 95,097 | 4.9% |
[ 2.0% - 2.5% ] 2.37% | 113,017 | 8.0% |
[ 2.0% - 2.5% ] 2.42% | 7,528 | 4.9% |
[ 2.0% - 2.5% ] 2.44% | 15,522 | 4.0% |
[ 2.5% - 3.0% ] 2.56% | 59,318 | 3.4% |
[ 2.5% - 3.0% ] 2.60% | 384 | 2.4% |
[ 2.5% - 3.0% ] 2.68% | 79,183 | 3.1% |
[ 2.5% - 3.0% ] 2.73% | 293 | 6.2% |
[ 2.5% - 3.0% ] 2.83% | 60,046 | 5.8% |
[ 2.5% - 3.0% ] 2.86% | 16,620 | 0.40% |
[ 2.5% - 3.0% ] 2.91% | 17,792 | 4.7% |
[ 2.5% - 3.0% ] 2.98% | 8,630 | 6.5% |
[ 2.5% - 3.0% ] 2.99% | 204,191 | 6.8% |
[ 3.0% - 3.5% ] 3.29% | 18,226 | 2.7% |
[ 3.0% - 3.5% ] 3.33% | 7,846 | 2.7% |
[ 3.0% - 3.5% ] 3.36% | 16,680 | 9.9% |
[ 3.0% - 3.5% ] 3.43% | 55,168 | 4.7% |
[ 3.0% - 3.5% ] 3.46% | 1,705 | 2.0% |
[ 3.5% - 4.0% ] 3.56% | 36,538 | 5.3% |
[ 3.5% - 4.0% ] 3.59% | 78,624 | 5.5% |
[ 3.5% - 4.0% ] 3.80% | 8,291 | 10.2% |
[ 3.5% - 4.0% ] 3.81% | 79,817 | 11.3% |
[ 3.5% - 4.0% ] 3.86% | 3,056 | 1.2% |
[ 3.5% - 4.0% ] 3.91% | 1,894 | 9.3% |
[ 3.5% - 4.0% ] 3.96% | 23,110 | 5.6% |
[ 4.0% - 4.5% ] 4.05% | 3,535 | 10.4% |
[ 4.0% - 4.5% ] 4.22% | 3,202 | 2.9% |
[ 4.0% - 4.5% ] 4.23% | 2,551 | 18.2% |
[ 4.0% - 4.5% ] 4.32% | 4,024 | 1.8% |
[ 4.0% - 4.5% ] 4.38% | 30,819 | 8.8% |
[ 4.5% - 5.0% ] 4.71% | 1,315 | 6.3% |
[ 4.5% - 5.0% ] 4.73% | 72,215 | 4.5% |
[ 4.5% - 5.0% ] 4.84% | 10,316 | 6.2% |
[ 4.5% - 5.0% ] 4.89% | 19,938 | 2.7% |
[ 4.5% - 5.0% ] 4.95% | 1,798 | 4.3% |
[ 6.0% - 6.5% ] 6.14% | 1,010 | 1.5% |
[ 7.0% - 7.5% ] 7.04% | 22,114 | 4.6% |
[ 7.0% - 7.5% ] 7.22% | 40,724 | 4.6% |
[ 7.0% - 7.5% ] 7.42% | 22,505 | 5.3% |