Immigrants from Korea Disability Age 5 to 17
COMPARE
Immigrants from Korea
Select to Compare
Disability Age 5 to 17
Immigrants from Korea Disability Age 5 to 17
4.7%
DISABILITY | AGE 5 TO 17
100.0/ 100
METRIC RATING
14th/ 347
METRIC RANK
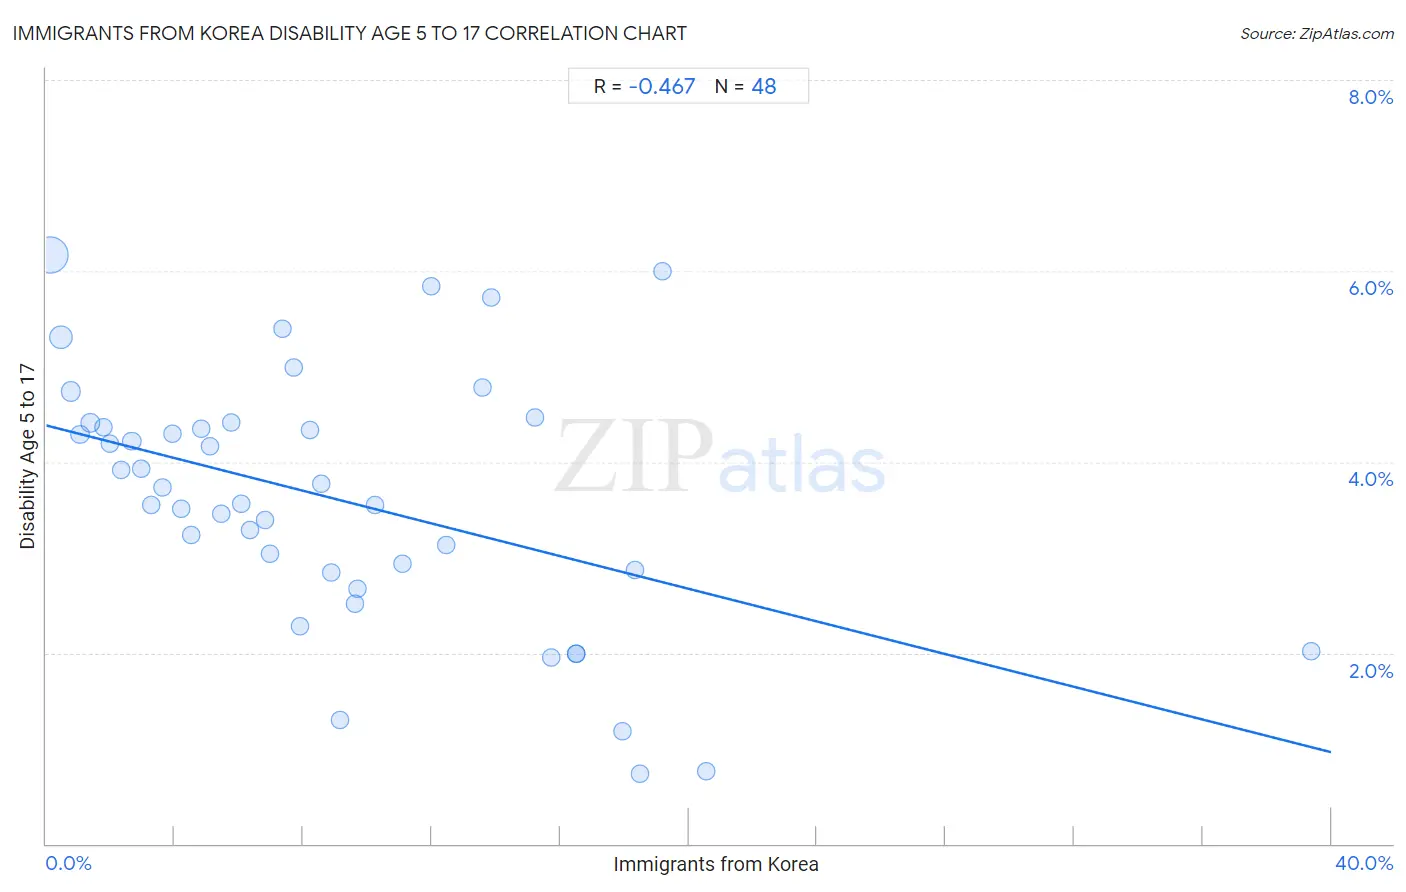
Immigrants from Korea Disability Age 5 to 17 Correlation Chart
The statistical analysis conducted on geographies consisting of 412,408,030 people shows a moderate negative correlation between the proportion of Immigrants from Korea and percentage of population with a disability between the ages 5 and 17 in the United States with a correlation coefficient (R) of -0.467 and weighted average of 4.7%. On average, for every 1% (one percent) increase in Immigrants from Korea within a typical geography, there is a decrease of 0.086% in percentage of population with a disability between the ages 5 and 17.
It is essential to understand that the correlation between the percentage of Immigrants from Korea and percentage of population with a disability between the ages 5 and 17 does not imply a direct cause-and-effect relationship. It remains uncertain whether the presence of Immigrants from Korea influences an upward or downward trend in the level of percentage of population with a disability between the ages 5 and 17 within an area, or if Immigrants from Korea simply ended up residing in those areas with higher or lower levels of percentage of population with a disability between the ages 5 and 17 due to other factors.
Demographics Similar to Immigrants from Korea by Disability Age 5 to 17
In terms of disability age 5 to 17, the demographic groups most similar to Immigrants from Korea are Chinese (4.7%, a difference of 0.20%), Immigrants from Singapore (4.7%, a difference of 0.63%), Thai (4.7%, a difference of 0.70%), Arapaho (4.7%, a difference of 1.1%), and Immigrants from South Central Asia (4.7%, a difference of 1.1%).
| Demographics | Rating | Rank | Disability Age 5 to 17 |
| Immigrants from China | 100.0 /100 | #7 | Exceptional 4.5% |
| Indians (Asian) | 100.0 /100 | #8 | Exceptional 4.6% |
| Immigrants from Eastern Asia | 100.0 /100 | #9 | Exceptional 4.6% |
| Immigrants from India | 100.0 /100 | #10 | Exceptional 4.6% |
| Armenians | 100.0 /100 | #11 | Exceptional 4.6% |
| Iranians | 100.0 /100 | #12 | Exceptional 4.6% |
| Thais | 100.0 /100 | #13 | Exceptional 4.7% |
| Immigrants from Korea | 100.0 /100 | #14 | Exceptional 4.7% |
| Chinese | 100.0 /100 | #15 | Exceptional 4.7% |
| Immigrants from Singapore | 100.0 /100 | #16 | Exceptional 4.7% |
| Arapaho | 100.0 /100 | #17 | Exceptional 4.7% |
| Immigrants from South Central Asia | 100.0 /100 | #18 | Exceptional 4.7% |
| Immigrants from Uzbekistan | 100.0 /100 | #19 | Exceptional 4.8% |
| Burmese | 100.0 /100 | #20 | Exceptional 4.8% |
| Yup'ik | 100.0 /100 | #21 | Exceptional 4.8% |
Immigrants from Korea Disability Age 5 to 17 Correlation Summary
| Measurement | Immigrants from Korea Data | Disability Age 5 to 17 Data |
| Minimum | 0.13% | 0.73% |
| Maximum | 39.4% | 6.2% |
| Range | 39.3% | 5.4% |
| Mean | 9.0% | 3.6% |
| Median | 7.5% | 3.6% |
| Interquartile 25% (IQ1) | 3.8% | 2.9% |
| Interquartile 75% (IQ3) | 13.0% | 4.4% |
| Interquartile Range (IQR) | 9.2% | 1.5% |
| Standard Deviation (Sample) | 7.2% | 1.3% |
| Standard Deviation (Population) | 7.2% | 1.3% |
Correlation Details
| Immigrants from Korea Percentile | Sample Size | Disability Age 5 to 17 |
[ 0.0% - 0.5% ] 0.13% | 260,675,590 | 6.2% |
[ 0.0% - 0.5% ] 0.45% | 77,659,121 | 5.3% |
[ 0.5% - 1.0% ] 0.76% | 28,803,674 | 4.7% |
[ 1.0% - 1.5% ] 1.07% | 15,596,368 | 4.3% |
[ 1.0% - 1.5% ] 1.37% | 7,524,453 | 4.4% |
[ 1.5% - 2.0% ] 1.78% | 7,634,031 | 4.4% |
[ 1.5% - 2.0% ] 1.99% | 3,095,019 | 4.2% |
[ 2.0% - 2.5% ] 2.32% | 1,881,796 | 3.9% |
[ 2.5% - 3.0% ] 2.66% | 1,727,371 | 4.2% |
[ 2.5% - 3.0% ] 2.96% | 1,355,265 | 3.9% |
[ 3.0% - 3.5% ] 3.28% | 904,904 | 3.6% |
[ 3.5% - 4.0% ] 3.61% | 583,658 | 3.7% |
[ 3.5% - 4.0% ] 3.94% | 433,030 | 4.3% |
[ 4.0% - 4.5% ] 4.20% | 479,081 | 3.5% |
[ 4.0% - 4.5% ] 4.50% | 531,934 | 3.2% |
[ 4.5% - 5.0% ] 4.83% | 477,037 | 4.4% |
[ 5.0% - 5.5% ] 5.12% | 191,887 | 4.2% |
[ 5.0% - 5.5% ] 5.45% | 233,121 | 3.5% |
[ 5.5% - 6.0% ] 5.75% | 250,189 | 4.4% |
[ 6.0% - 6.5% ] 6.05% | 176,563 | 3.6% |
[ 6.0% - 6.5% ] 6.33% | 195,966 | 3.3% |
[ 6.5% - 7.0% ] 6.79% | 162,090 | 3.4% |
[ 6.5% - 7.0% ] 6.96% | 82,315 | 3.0% |
[ 7.0% - 7.5% ] 7.37% | 93,669 | 5.4% |
[ 7.5% - 8.0% ] 7.69% | 224,852 | 5.0% |
[ 7.5% - 8.0% ] 7.91% | 170,007 | 2.3% |
[ 8.0% - 8.5% ] 8.21% | 237,186 | 4.3% |
[ 8.5% - 9.0% ] 8.56% | 189,327 | 3.8% |
[ 8.5% - 9.0% ] 8.85% | 147,426 | 2.8% |
[ 9.0% - 9.5% ] 9.16% | 51,089 | 1.3% |
[ 9.5% - 10.0% ] 9.62% | 31,426 | 2.5% |
[ 9.5% - 10.0% ] 9.69% | 98,267 | 2.7% |
[ 10.0% - 10.5% ] 10.25% | 37,647 | 3.5% |
[ 11.0% - 11.5% ] 11.09% | 56,628 | 2.9% |
[ 11.5% - 12.0% ] 11.98% | 9,273 | 5.8% |
[ 12.0% - 12.5% ] 12.46% | 30,598 | 3.1% |
[ 13.5% - 14.0% ] 13.57% | 36,151 | 4.8% |
[ 13.5% - 14.0% ] 13.86% | 20,008 | 5.7% |
[ 15.0% - 15.5% ] 15.20% | 52,799 | 4.5% |
[ 15.5% - 16.0% ] 15.71% | 18,210 | 2.0% |
[ 16.0% - 16.5% ] 16.50% | 39,799 | 2.0% |
[ 16.5% - 17.0% ] 16.50% | 39,781 | 2.0% |
[ 17.5% - 18.0% ] 17.93% | 37,754 | 1.2% |
[ 18.0% - 18.5% ] 18.33% | 38,400 | 2.9% |
[ 18.0% - 18.5% ] 18.50% | 18,564 | 0.73% |
[ 19.0% - 19.5% ] 19.20% | 22,930 | 6.0% |
[ 20.5% - 21.0% ] 20.56% | 11,314 | 0.76% |
[ 39.0% - 39.5% ] 39.39% | 40,462 | 2.0% |