Immigrants from Costa Rica Disability Age 5 to 17

COMPARE

Immigrants from Costa Rica
Race
Ancestry
AfghanAfricanAlaska NativeAlaskan AthabascanAlbanianAleutAlsatianAmericanApacheArabArapahoArgentineanArmenianAssyrian/Chaldean/SyriacAustralianAustrianBahamianBangladeshiBarbadianBasqueBelgianBelizeanBermudanBhutaneseBlackfeetBolivianBrazilianBritishBritish West IndianBulgarianBurmeseCajunCambodianCanadianCape VerdeanCarpatho RusynCelticCentral AmericanCentral American IndianCherokeeCheyenneChickasawChileanChineseChippewaChoctawColombianColvilleComancheCosta RicanCreeCreekCroatianCrowCubanCypriotCzechCzechoslovakianDanishDelawareDominicanDutchDutch West IndianEastern EuropeanEcuadorianEgyptianEnglishEstonianEthiopianEuropeanFijianFilipinoFinnishFrenchFrench American IndianFrench CanadianGermanGerman RussianGhanaianGreekGuamanian/ChamorroGuatemalanGuyaneseHaitianHmongHonduranHopiHoumaHungarianIcelanderIndian (Asian)IndonesianInupiatIranianIraqiIrishIroquoisIsraeliItalianJamaicanJapaneseJordanianKenyanKiowaKoreanLaotianLatvianLebaneseLiberianLithuanianLumbeeLuxembourgerMacedonianMalaysianMalteseMarshalleseMenomineeMexicanMexican American IndianMongolianMoroccanNative HawaiianNavajoNepaleseNew ZealanderNicaraguanNigerianNorthern EuropeanNorwegianOkinawanOsageOttawaPaiutePakistaniPalestinianPanamanianParaguayanPennsylvania GermanPeruvianPimaPolishPortuguesePotawatomiPuebloPuerto RicanPuget Sound SalishRomanianRussianSalvadoranSamoanScandinavianScotch-IrishScottishSeminoleSenegaleseSerbianShoshoneSierra LeoneanSiouxSlavicSlovakSloveneSomaliSouth AfricanSouth AmericanSouth American IndianSoviet UnionSpaniardSpanishSpanish AmericanSpanish American IndianSri LankanSubsaharan AfricanSudaneseSwedishSwissSyrianTaiwaneseThaiTlingit-HaidaTohono O'OdhamTonganTrinidadian and TobagonianTsimshianTurkishU.S. Virgin IslanderUgandanUkrainianUruguayanUteVenezuelanVietnameseWelshWest IndianYakamaYaquiYugoslavianYumanYup'ikZimbabwean
Immigration
NonimmigrantsImmigrantsAfghanistanAfricaAlbaniaArgentinaArmeniaAsiaAustraliaAustriaBahamasBangladeshBarbadosBelarusBelgiumBelizeBoliviaBosnia and HerzegovinaBrazilBulgariaBurma/MyanmarCabo VerdeCambodiaCameroonCanadaCaribbeanCentral AmericaChileChinaColombiaCongoCosta RicaCroatiaCubaCzechoslovakiaDenmarkDominicaDominican RepublicEastern AfricaEastern AsiaEastern EuropeEcuadorEgyptEl SalvadorEnglandEritreaEthiopiaEuropeFijiFranceGermanyGhanaGreeceGrenadaGuatemalaGuyanaHaitiHondurasHong KongHungaryIndiaIndonesiaIranIraqIrelandIsraelItalyJamaicaJapanJordanKazakhstanKenyaKoreaKuwaitLaosLatin AmericaLatviaLebanonLiberiaLithuaniaMalaysiaMexicoMicronesiaMiddle AfricaMoldovaMoroccoNepalNetherlandsNicaraguaNigeriaNorth AmericaNorth MacedoniaNorthern AfricaNorthern EuropeNorwayOceaniaPakistanPanamaPeruPhilippinesPolandPortugalRomaniaRussiaSaudi ArabiaScotlandSenegalSerbiaSierra LeoneSingaporeSomaliaSouth AfricaSouth AmericaSouth Central AsiaSouth Eastern AsiaSouthern EuropeSpainSri LankaSt. Vincent and the GrenadinesSudanSwedenSwitzerlandSyriaTaiwanThailandTrinidad and TobagoTurkeyUgandaUkraineUruguayUzbekistanVenezuelaVietnamWest IndiesWestern AfricaWestern AsiaWestern EuropeYemenZaireZimbabweAzores
Select to Compare
Race
Ancestry
AfghanAfricanAlaska NativeAlaskan AthabascanAlbanianAleutAlsatianAmericanApacheArabArapahoArgentineanArmenianAssyrian/Chaldean/SyriacAustralianAustrianBahamianBangladeshiBarbadianBasqueBelgianBelizeanBermudanBhutaneseBlackfeetBolivianBrazilianBritishBritish West IndianBulgarianBurmeseCajunCambodianCanadianCape VerdeanCarpatho RusynCelticCentral AmericanCentral American IndianCherokeeCheyenneChickasawChileanChineseChippewaChoctawColombianColvilleComancheCosta RicanCreeCreekCroatianCrowCubanCypriotCzechCzechoslovakianDanishDelawareDominicanDutchDutch West IndianEastern EuropeanEcuadorianEgyptianEnglishEstonianEthiopianEuropeanFijianFilipinoFinnishFrenchFrench American IndianFrench CanadianGermanGerman RussianGhanaianGreekGuamanian/ChamorroGuatemalanGuyaneseHaitianHmongHonduranHopiHoumaHungarianIcelanderIndian (Asian)IndonesianInupiatIranianIraqiIrishIroquoisIsraeliItalianJamaicanJapaneseJordanianKenyanKiowaKoreanLaotianLatvianLebaneseLiberianLithuanianLumbeeLuxembourgerMacedonianMalaysianMalteseMarshalleseMenomineeMexicanMexican American IndianMongolianMoroccanNative HawaiianNavajoNepaleseNew ZealanderNicaraguanNigerianNorthern EuropeanNorwegianOkinawanOsageOttawaPaiutePakistaniPalestinianPanamanianParaguayanPennsylvania GermanPeruvianPimaPolishPortuguesePotawatomiPuebloPuerto RicanPuget Sound SalishRomanianRussianSalvadoranSamoanScandinavianScotch-IrishScottishSeminoleSenegaleseSerbianShoshoneSierra LeoneanSiouxSlavicSlovakSloveneSomaliSouth AfricanSouth AmericanSouth American IndianSoviet UnionSpaniardSpanishSpanish AmericanSpanish American IndianSri LankanSubsaharan AfricanSudaneseSwedishSwissSyrianTaiwaneseThaiTlingit-HaidaTohono O'OdhamTonganTrinidadian and TobagonianTsimshianTurkishU.S. Virgin IslanderUgandanUkrainianUruguayanUteVenezuelanVietnameseWelshWest IndianYakamaYaquiYugoslavianYumanYup'ikZimbabwean
Immigration
NonimmigrantsImmigrantsAfghanistanAfricaAlbaniaArgentinaArmeniaAsiaAustraliaAustriaBahamasBangladeshBarbadosBelarusBelgiumBelizeBoliviaBosnia and HerzegovinaBrazilBulgariaBurma/MyanmarCabo VerdeCambodiaCameroonCanadaCaribbeanCentral AmericaChileChinaColombiaCongoCroatiaCubaCzechoslovakiaDenmarkDominicaDominican RepublicEastern AfricaEastern AsiaEastern EuropeEcuadorEgyptEl SalvadorEnglandEritreaEthiopiaEuropeFijiFranceGermanyGhanaGreeceGrenadaGuatemalaGuyanaHaitiHondurasHong KongHungaryIndiaIndonesiaIranIraqIrelandIsraelItalyJamaicaJapanJordanKazakhstanKenyaKoreaKuwaitLaosLatin AmericaLatviaLebanonLiberiaLithuaniaMalaysiaMexicoMicronesiaMiddle AfricaMoldovaMoroccoNepalNetherlandsNicaraguaNigeriaNorth AmericaNorth MacedoniaNorthern AfricaNorthern EuropeNorwayOceaniaPakistanPanamaPeruPhilippinesPolandPortugalRomaniaRussiaSaudi ArabiaScotlandSenegalSerbiaSierra LeoneSingaporeSomaliaSouth AfricaSouth AmericaSouth Central AsiaSouth Eastern AsiaSouthern EuropeSpainSri LankaSt. Vincent and the GrenadinesSudanSwedenSwitzerlandSyriaTaiwanThailandTrinidad and TobagoTurkeyUgandaUkraineUruguayUzbekistanVenezuelaVietnamWest IndiesWestern AfricaWestern AsiaWestern EuropeYemenZaireZimbabweAzores
Disability Age 5 to 17
Income
Poverty
Unemployment
Labor Participation
Family Structure
Vehicle Availability
Education Level
Disability

Immigrants from Costa Rica Disability Age 5 to 17
Good

5.5%
DISABILITY | AGE 5 TO 17
77.9/ 100
METRIC RATING
157th/ 347
METRIC RANK

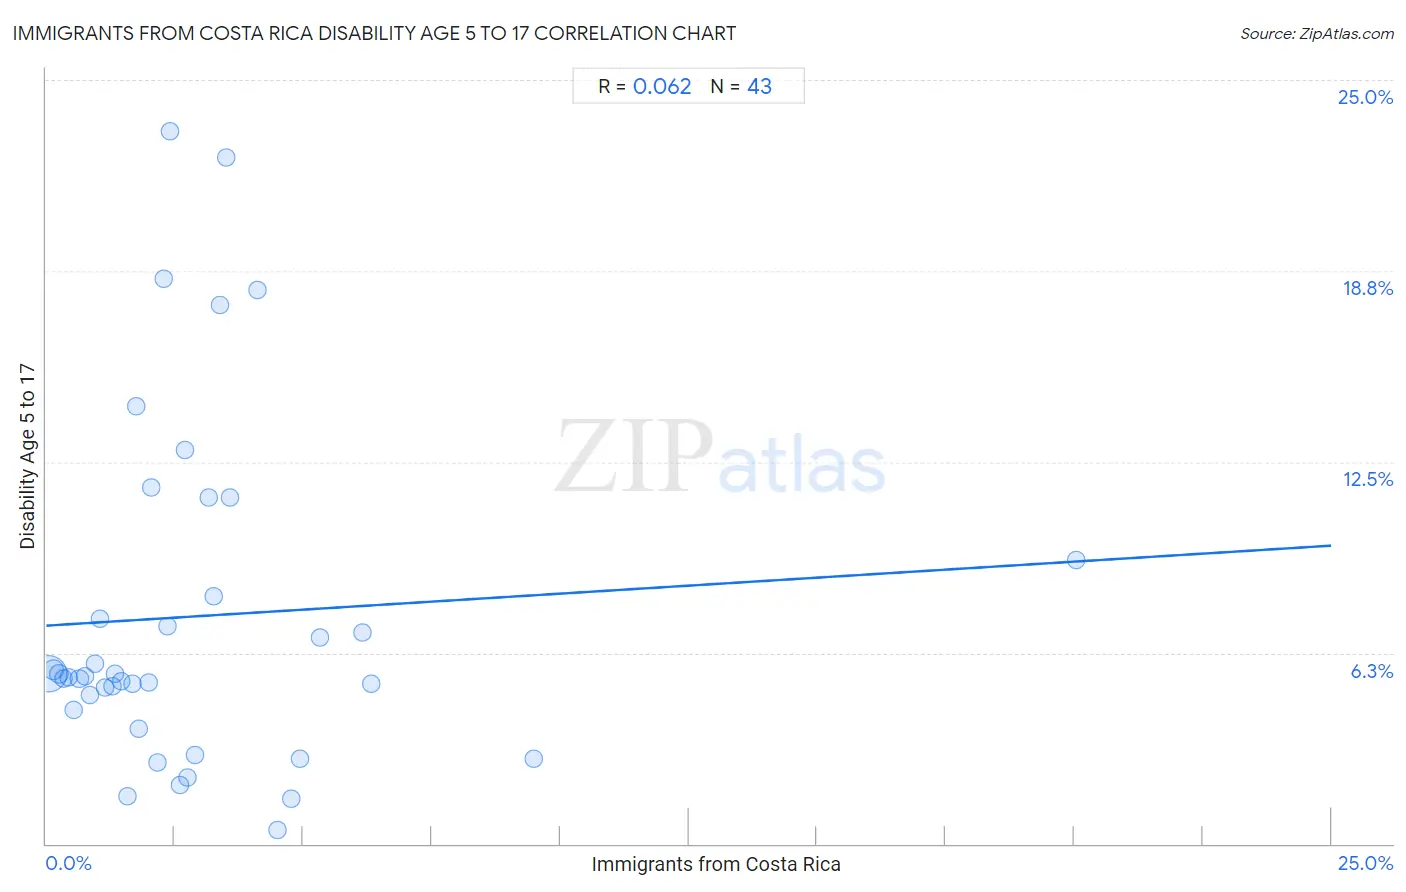
Immigrants from Costa Rica Disability Age 5 to 17 Correlation Chart

The statistical analysis conducted on geographies consisting of 203,667,525 people shows a slight positive correlation between the proportion of Immigrants from Costa Rica and percentage of population with a disability between the ages 5 and 17 in the United States with a correlation coefficient (R) of 0.062 and weighted average of 5.5%. On average, for every 1% (one percent) increase in Immigrants from Costa Rica within a typical geography, there is an increase of 0.10% in percentage of population with a disability between the ages 5 and 17.
Immigrants from Costa Rica Disability Age 5 to 17
It is essential to understand that the correlation between the percentage of Immigrants from Costa Rica and percentage of population with a disability between the ages 5 and 17 does not imply a direct cause-and-effect relationship. It remains uncertain whether the presence of Immigrants from Costa Rica influences an upward or downward trend in the level of percentage of population with a disability between the ages 5 and 17 within an area, or if Immigrants from Costa Rica simply ended up residing in those areas with higher or lower levels of percentage of population with a disability between the ages 5 and 17 due to other factors.

Demographics Similar to Immigrants from Costa Rica by Disability Age 5 to 17

In terms of disability age 5 to 17, the demographic groups most similar to Immigrants from Costa Rica are Hawaiian (5.5%, a difference of 0.010%), Immigrants from Ecuador (5.5%, a difference of 0.030%), Immigrants from Nepal (5.5%, a difference of 0.050%), Australian (5.5%, a difference of 0.070%), and Ecuadorian (5.5%, a difference of 0.14%).
DemographicsRating | RankDisability Age 5 to 17
Guatemalans
81.5
/100
|
#150
Excellent
5.5%
Estonians
80.8
/100
|
#151
Excellent
5.5%
Ute
80.6
/100
|
#152
Excellent
5.5%
Ecuadorians
79.7
/100
|
#153
Good
5.5%
Australians
78.8
/100
|
#154
Good
5.5%
Immigrants from Ecuador
78.3
/100
|
#155
Good
5.5%
Hawaiians
78.0
/100
|
#156
Good
5.5%
Immigrants from Costa Rica
77.9
/100
|
#157
Good
5.5%
Immigrants from Nepal
77.1
/100
|
#158
Good
5.5%
Immigrants from Zimbabwe
75.3
/100
|
#159
Good
5.5%
South Africans
73.3
/100
|
#160
Good
5.5%
Immigrants from Saudi Arabia
69.1
/100
|
#161
Good
5.5%
Zimbabweans
67.2
/100
|
#162
Good
5.5%
Immigrants from Southern Europe
64.0
/100
|
#163
Good
5.6%
Immigrants from Scotland
61.9
/100
|
#164
Good
5.6%

Immigrants from Costa Rica Disability Age 5 to 17 Correlation Summary

MeasurementImmigrants from Costa Rica DataDisability Age 5 to 17 Data
Minimum0.037%0.44%
Maximum20.0%23.3%
Range20.0%22.9%
Mean2.9%7.4%
Median2.2%5.5%
Interquartile 25% (IQ1)1.1%4.4%
Interquartile 75% (IQ3)3.5%9.3%
Interquartile Range (IQR)2.4%4.9%
Standard Deviation (Sample)3.3%5.6%
Standard Deviation (Population)3.3%5.5%

Correlation Details

Immigrants from Costa Rica PercentileSample SizeDisability Age 5 to 17
[
0.0%
-
0.5%
]
0.037%
161,191,1195.6%
[
0.0%
-
0.5%
]
0.14%
25,206,2035.7%
[
0.0%
-
0.5%
]
0.25%
7,948,8995.5%
[
0.0%
-
0.5%
]
0.34%
3,429,9085.4%
[
0.0%
-
0.5%
]
0.44%
1,698,1685.4%
[
0.5%
-
1.0%
]
0.54%
1,186,7624.4%
[
0.5%
-
1.0%
]
0.64%
981,7725.4%
[
0.5%
-
1.0%
]
0.74%
392,6235.5%
[
0.5%
-
1.0%
]
0.84%
379,5504.9%
[
0.5%
-
1.0%
]
0.95%
232,8645.9%
[
1.0%
-
1.5%
]
1.05%
207,6577.4%
[
1.0%
-
1.5%
]
1.14%
109,6845.1%
[
1.0%
-
1.5%
]
1.28%
215,9885.2%
[
1.0%
-
1.5%
]
1.33%
59,6815.6%
[
1.0%
-
1.5%
]
1.45%
42,3585.3%
[
1.5%
-
2.0%
]
1.57%
3,3691.5%
[
1.5%
-
2.0%
]
1.68%
62,5035.2%
[
1.5%
-
2.0%
]
1.74%
4,58914.3%
[
1.5%
-
2.0%
]
1.81%
28,5213.7%
[
1.5%
-
2.0%
]
1.98%
52,9385.3%
[
2.0%
-
2.5%
]
2.05%
9,26611.6%
[
2.0%
-
2.5%
]
2.17%
26,6242.7%
[
2.0%
-
2.5%
]
2.27%
10,63818.5%
[
2.0%
-
2.5%
]
2.36%
13,4177.1%
[
2.0%
-
2.5%
]
2.42%
20723.3%
[
2.5%
-
3.0%
]
2.59%
24,2811.9%
[
2.5%
-
3.0%
]
2.70%
1,59412.9%
[
2.5%
-
3.0%
]
2.74%
45,9492.2%
[
2.5%
-
3.0%
]
2.88%
33,5412.9%
[
3.0%
-
3.5%
]
3.16%
72811.3%
[
3.0%
-
3.5%
]
3.25%
18,8908.1%
[
3.0%
-
3.5%
]
3.39%
5,22617.6%
[
3.5%
-
4.0%
]
3.50%
62822.4%
[
3.5%
-
4.0%
]
3.57%
64511.3%
[
4.0%
-
4.5%
]
4.12%
75318.1%
[
4.0%
-
4.5%
]
4.50%
7340.44%
[
4.5%
-
5.0%
]
4.77%
8,2871.5%
[
4.5%
-
5.0%
]
4.94%
1,5192.8%
[
5.0%
-
5.5%
]
5.32%
14,7896.8%
[
6.0%
-
6.5%
]
6.15%
1,5946.9%
[
6.0%
-
6.5%
]
6.33%
11,9065.2%
[
9.0%
-
9.5%
]
9.49%
5692.8%
[
20.0%
-
20.5%
]
20.03%
5849.3%