Immigrants from Cuba Disability Age 5 to 17
COMPARE
Immigrants from Cuba
Select to Compare
Disability Age 5 to 17
Immigrants from Cuba Disability Age 5 to 17
5.2%
DISABILITY | AGE 5 TO 17
99.6/ 100
METRIC RATING
78th/ 347
METRIC RANK
Immigrants from Cuba Disability Age 5 to 17 Correlation Chart
The statistical analysis conducted on geographies consisting of 323,753,754 people shows a weak negative correlation between the proportion of Immigrants from Cuba and percentage of population with a disability between the ages 5 and 17 in the United States with a correlation coefficient (R) of -0.231 and weighted average of 5.2%. On average, for every 1% (one percent) increase in Immigrants from Cuba within a typical geography, there is a decrease of 0.028% in percentage of population with a disability between the ages 5 and 17.
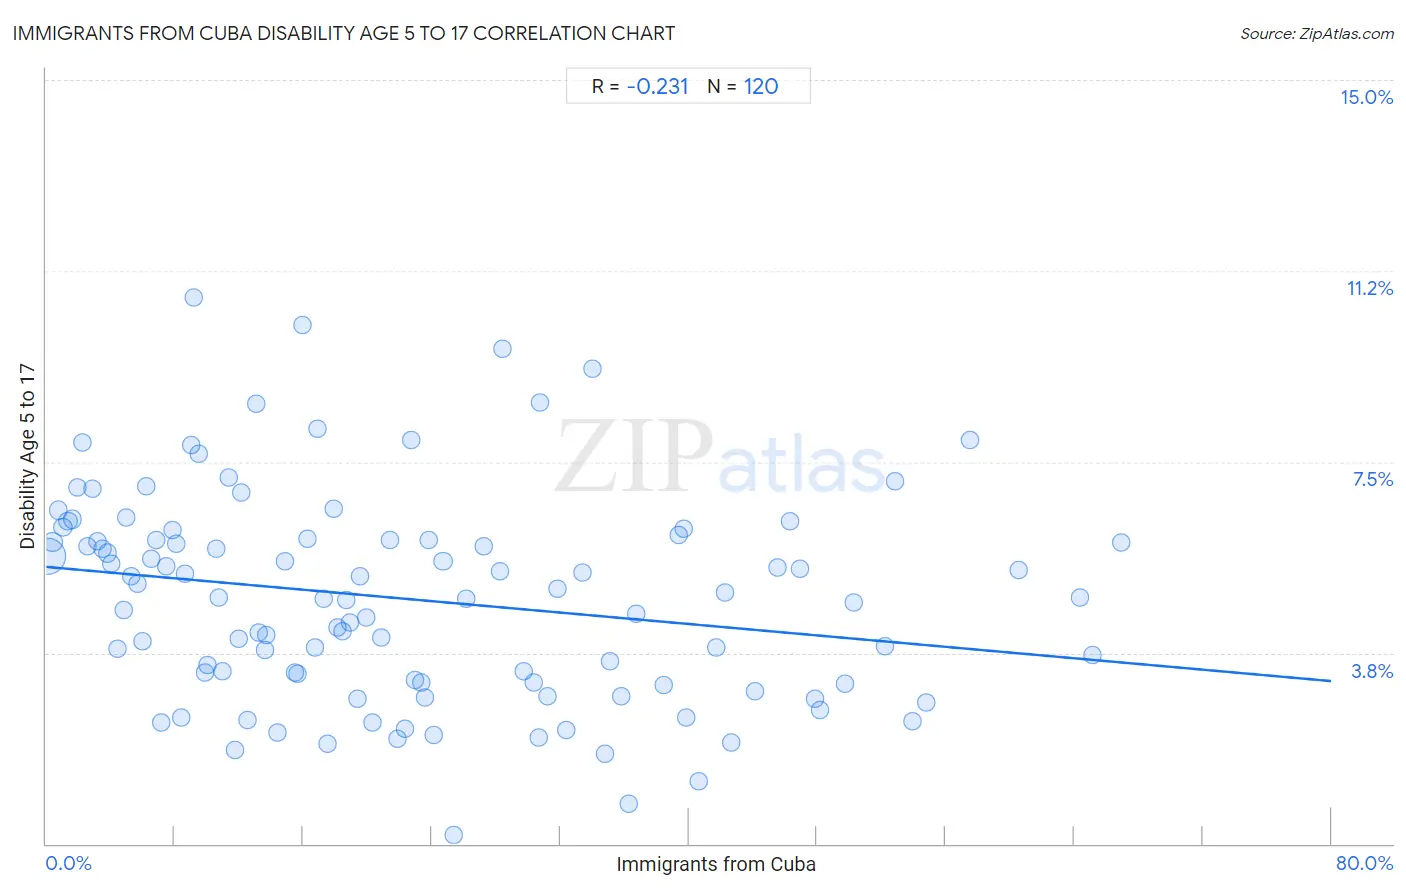
It is essential to understand that the correlation between the percentage of Immigrants from Cuba and percentage of population with a disability between the ages 5 and 17 does not imply a direct cause-and-effect relationship. It remains uncertain whether the presence of Immigrants from Cuba influences an upward or downward trend in the level of percentage of population with a disability between the ages 5 and 17 within an area, or if Immigrants from Cuba simply ended up residing in those areas with higher or lower levels of percentage of population with a disability between the ages 5 and 17 due to other factors.
Demographics Similar to Immigrants from Cuba by Disability Age 5 to 17
In terms of disability age 5 to 17, the demographic groups most similar to Immigrants from Cuba are Immigrants from Kazakhstan (5.2%, a difference of 0.010%), Immigrants from Guyana (5.2%, a difference of 0.040%), Afghan (5.2%, a difference of 0.040%), Sri Lankan (5.2%, a difference of 0.060%), and Immigrants from Moldova (5.2%, a difference of 0.070%).
| Demographics | Rating | Rank | Disability Age 5 to 17 |
| Jordanians | 99.7 /100 | #71 | Exceptional 5.2% |
| Immigrants from Vietnam | 99.7 /100 | #72 | Exceptional 5.2% |
| Immigrants from Czechoslovakia | 99.7 /100 | #73 | Exceptional 5.2% |
| Immigrants from Romania | 99.7 /100 | #74 | Exceptional 5.2% |
| Immigrants from Moldova | 99.6 /100 | #75 | Exceptional 5.2% |
| Immigrants from Guyana | 99.6 /100 | #76 | Exceptional 5.2% |
| Immigrants from Kazakhstan | 99.6 /100 | #77 | Exceptional 5.2% |
| Immigrants from Cuba | 99.6 /100 | #78 | Exceptional 5.2% |
| Afghans | 99.6 /100 | #79 | Exceptional 5.2% |
| Sri Lankans | 99.6 /100 | #80 | Exceptional 5.2% |
| Native Hawaiians | 99.6 /100 | #81 | Exceptional 5.2% |
| Immigrants from Sweden | 99.5 /100 | #82 | Exceptional 5.2% |
| Immigrants from France | 99.5 /100 | #83 | Exceptional 5.2% |
| Immigrants from Nicaragua | 99.5 /100 | #84 | Exceptional 5.2% |
| Bulgarians | 99.4 /100 | #85 | Exceptional 5.2% |
Immigrants from Cuba Disability Age 5 to 17 Correlation Summary
| Measurement | Immigrants from Cuba Data | Disability Age 5 to 17 Data |
| Minimum | 0.095% | 0.17% |
| Maximum | 66.9% | 10.7% |
| Range | 66.8% | 10.6% |
| Mean | 22.8% | 4.8% |
| Median | 18.8% | 4.8% |
| Interquartile 25% (IQ1) | 9.1% | 3.2% |
| Interquartile 75% (IQ3) | 34.4% | 6.0% |
| Interquartile Range (IQR) | 25.3% | 2.8% |
| Standard Deviation (Sample) | 16.8% | 2.0% |
| Standard Deviation (Population) | 16.8% | 2.0% |
Correlation Details
| Immigrants from Cuba Percentile | Sample Size | Disability Age 5 to 17 |
[ 0.0% - 0.5% ] 0.095% | 251,964,646 | 5.6% |
[ 0.0% - 0.5% ] 0.43% | 29,888,777 | 5.9% |
[ 0.5% - 1.0% ] 0.74% | 11,597,576 | 6.5% |
[ 1.0% - 1.5% ] 1.04% | 6,565,103 | 6.2% |
[ 1.0% - 1.5% ] 1.35% | 4,222,078 | 6.3% |
[ 1.5% - 2.0% ] 1.66% | 2,649,350 | 6.4% |
[ 1.5% - 2.0% ] 1.96% | 2,708,027 | 7.0% |
[ 2.0% - 2.5% ] 2.29% | 1,214,303 | 7.9% |
[ 2.5% - 3.0% ] 2.57% | 776,350 | 5.9% |
[ 2.5% - 3.0% ] 2.88% | 999,897 | 7.0% |
[ 3.0% - 3.5% ] 3.19% | 641,658 | 5.9% |
[ 3.0% - 3.5% ] 3.50% | 594,237 | 5.8% |
[ 3.5% - 4.0% ] 3.78% | 652,314 | 5.7% |
[ 4.0% - 4.5% ] 4.05% | 265,111 | 5.5% |
[ 4.0% - 4.5% ] 4.47% | 200,575 | 3.8% |
[ 4.5% - 5.0% ] 4.79% | 659,117 | 4.6% |
[ 5.0% - 5.5% ] 5.01% | 351,584 | 6.4% |
[ 5.0% - 5.5% ] 5.29% | 355,191 | 5.2% |
[ 5.5% - 6.0% ] 5.66% | 400,843 | 5.1% |
[ 5.5% - 6.0% ] 5.96% | 241,615 | 4.0% |
[ 6.0% - 6.5% ] 6.19% | 317,234 | 7.0% |
[ 6.5% - 7.0% ] 6.54% | 179,240 | 5.6% |
[ 6.5% - 7.0% ] 6.81% | 395,301 | 6.0% |
[ 7.0% - 7.5% ] 7.16% | 51,934 | 2.4% |
[ 7.0% - 7.5% ] 7.46% | 204,593 | 5.4% |
[ 7.5% - 8.0% ] 7.84% | 264,631 | 6.2% |
[ 8.0% - 8.5% ] 8.06% | 116,818 | 5.9% |
[ 8.0% - 8.5% ] 8.39% | 7,589 | 2.5% |
[ 8.5% - 9.0% ] 8.62% | 38,542 | 5.3% |
[ 9.0% - 9.5% ] 9.05% | 23,774 | 7.8% |
[ 9.0% - 9.5% ] 9.15% | 43,424 | 10.7% |
[ 9.5% - 10.0% ] 9.52% | 119,826 | 7.7% |
[ 9.5% - 10.0% ] 9.90% | 76,717 | 3.4% |
[ 10.0% - 10.5% ] 10.08% | 69,034 | 3.5% |
[ 10.5% - 11.0% ] 10.56% | 181,514 | 5.8% |
[ 10.5% - 11.0% ] 10.71% | 80,262 | 4.8% |
[ 11.0% - 11.5% ] 11.01% | 57,923 | 3.4% |
[ 11.0% - 11.5% ] 11.37% | 114,298 | 7.2% |
[ 11.5% - 12.0% ] 11.72% | 26,094 | 1.8% |
[ 11.5% - 12.0% ] 11.97% | 106,074 | 4.0% |
[ 12.0% - 12.5% ] 12.18% | 38,774 | 6.9% |
[ 12.5% - 13.0% ] 12.54% | 63,572 | 2.4% |
[ 13.0% - 13.5% ] 13.05% | 15,218 | 8.6% |
[ 13.0% - 13.5% ] 13.23% | 149,277 | 4.1% |
[ 13.5% - 14.0% ] 13.59% | 35,710 | 3.8% |
[ 13.5% - 14.0% ] 13.71% | 34,336 | 4.1% |
[ 14.0% - 14.5% ] 14.38% | 62,961 | 2.2% |
[ 14.5% - 15.0% ] 14.89% | 10,581 | 5.5% |
[ 15.0% - 15.5% ] 15.46% | 82,400 | 3.4% |
[ 15.5% - 16.0% ] 15.63% | 117,398 | 3.3% |
[ 15.5% - 16.0% ] 15.97% | 24,257 | 10.2% |
[ 16.0% - 16.5% ] 16.25% | 106,757 | 6.0% |
[ 16.5% - 17.0% ] 16.71% | 10,992 | 3.9% |
[ 16.5% - 17.0% ] 16.88% | 10,597 | 8.1% |
[ 17.0% - 17.5% ] 17.25% | 47,065 | 4.8% |
[ 17.5% - 18.0% ] 17.50% | 18,719 | 2.0% |
[ 17.5% - 18.0% ] 17.88% | 59,121 | 6.6% |
[ 18.0% - 18.5% ] 18.13% | 26,717 | 4.2% |
[ 18.0% - 18.5% ] 18.42% | 164,883 | 4.2% |
[ 18.5% - 19.0% ] 18.65% | 115,926 | 4.8% |
[ 18.5% - 19.0% ] 18.93% | 48,849 | 4.3% |
[ 19.0% - 19.5% ] 19.36% | 100,913 | 2.9% |
[ 19.5% - 20.0% ] 19.54% | 11,943 | 5.2% |
[ 19.5% - 20.0% ] 19.95% | 143,303 | 4.4% |
[ 20.0% - 20.5% ] 20.29% | 85,659 | 2.4% |
[ 20.5% - 21.0% ] 20.82% | 52,197 | 4.0% |
[ 21.0% - 21.5% ] 21.43% | 32,946 | 6.0% |
[ 21.5% - 22.0% ] 21.84% | 16,776 | 2.1% |
[ 22.0% - 22.5% ] 22.36% | 8,617 | 2.3% |
[ 22.5% - 23.0% ] 22.72% | 27,033 | 7.9% |
[ 22.5% - 23.0% ] 22.97% | 22,927 | 3.2% |
[ 23.0% - 23.5% ] 23.35% | 26,364 | 3.2% |
[ 23.5% - 24.0% ] 23.59% | 84,418 | 2.9% |
[ 23.5% - 24.0% ] 23.82% | 14,477 | 6.0% |
[ 24.0% - 24.5% ] 24.15% | 57,327 | 2.1% |
[ 24.5% - 25.0% ] 24.71% | 463,011 | 5.6% |
[ 25.0% - 25.5% ] 25.34% | 8,989 | 0.17% |
[ 26.0% - 26.5% ] 26.13% | 2,419 | 4.8% |
[ 27.0% - 27.5% ] 27.25% | 73,954 | 5.8% |
[ 28.0% - 28.5% ] 28.25% | 37,958 | 5.4% |
[ 28.0% - 28.5% ] 28.43% | 60,573 | 9.7% |
[ 29.5% - 30.0% ] 29.74% | 68,517 | 3.4% |
[ 30.0% - 30.5% ] 30.32% | 80,505 | 3.2% |
[ 30.5% - 31.0% ] 30.65% | 40,718 | 2.1% |
[ 30.5% - 31.0% ] 30.73% | 86,031 | 8.7% |
[ 31.0% - 31.5% ] 31.17% | 40,278 | 2.9% |
[ 31.5% - 32.0% ] 31.79% | 5,303 | 5.0% |
[ 32.0% - 32.5% ] 32.40% | 2,318 | 2.2% |
[ 33.0% - 33.5% ] 33.42% | 30,621 | 5.3% |
[ 34.0% - 34.5% ] 34.03% | 35,705 | 9.3% |
[ 34.5% - 35.0% ] 34.79% | 57,066 | 1.8% |
[ 35.0% - 35.5% ] 35.07% | 60,279 | 3.6% |
[ 35.5% - 36.0% ] 35.78% | 37,977 | 2.9% |
[ 36.0% - 36.5% ] 36.29% | 3,400 | 0.78% |
[ 36.5% - 37.0% ] 36.74% | 54,873 | 4.5% |
[ 38.0% - 38.5% ] 38.43% | 43,702 | 3.1% |
[ 39.0% - 39.5% ] 39.35% | 34,057 | 6.1% |
[ 39.5% - 40.0% ] 39.68% | 34,742 | 6.2% |
[ 39.5% - 40.0% ] 39.87% | 49,483 | 2.5% |
[ 40.5% - 41.0% ] 40.65% | 34,335 | 1.2% |
[ 41.5% - 42.0% ] 41.73% | 13,824 | 3.9% |
[ 42.0% - 42.5% ] 42.27% | 52,661 | 4.9% |
[ 42.5% - 43.0% ] 42.62% | 19,399 | 2.0% |
[ 44.0% - 44.5% ] 44.13% | 55,241 | 3.0% |
[ 45.5% - 46.0% ] 45.55% | 24,597 | 5.4% |
[ 46.0% - 46.5% ] 46.31% | 40,739 | 6.3% |
[ 46.5% - 47.0% ] 46.90% | 10,725 | 5.4% |
[ 47.5% - 48.0% ] 47.86% | 52,851 | 2.9% |
[ 48.0% - 48.5% ] 48.15% | 53,765 | 2.6% |
[ 49.5% - 50.0% ] 49.72% | 50,233 | 3.1% |
[ 50.0% - 50.5% ] 50.26% | 46,798 | 4.7% |
[ 52.0% - 52.5% ] 52.20% | 52,047 | 3.9% |
[ 52.5% - 53.0% ] 52.80% | 45,620 | 7.1% |
[ 53.5% - 54.0% ] 53.93% | 22,815 | 2.4% |
[ 54.5% - 55.0% ] 54.81% | 20,850 | 2.8% |
[ 57.5% - 58.0% ] 57.54% | 26,596 | 7.9% |
[ 60.5% - 61.0% ] 60.57% | 222,996 | 5.4% |
[ 64.0% - 64.5% ] 64.39% | 71,088 | 4.8% |
[ 65.0% - 65.5% ] 65.17% | 29,830 | 3.7% |
[ 66.5% - 67.0% ] 66.94% | 42,081 | 5.9% |