Arab Disability Age 5 to 17

COMPARE

Arab
Race
Ancestry
AfghanAfricanAlaska NativeAlaskan AthabascanAlbanianAleutAlsatianAmericanApacheArabArapahoArgentineanArmenianAssyrian/Chaldean/SyriacAustralianAustrianBahamianBangladeshiBarbadianBasqueBelgianBelizeanBermudanBhutaneseBlackfeetBolivianBrazilianBritishBritish West IndianBulgarianBurmeseCajunCambodianCanadianCape VerdeanCarpatho RusynCelticCentral AmericanCentral American IndianCherokeeCheyenneChickasawChileanChineseChippewaChoctawColombianColvilleComancheCosta RicanCreeCreekCroatianCrowCubanCypriotCzechCzechoslovakianDanishDelawareDominicanDutchDutch West IndianEastern EuropeanEcuadorianEgyptianEnglishEstonianEthiopianEuropeanFijianFilipinoFinnishFrenchFrench American IndianFrench CanadianGermanGerman RussianGhanaianGreekGuamanian/ChamorroGuatemalanGuyaneseHaitianHmongHonduranHopiHoumaHungarianIcelanderIndian (Asian)IndonesianInupiatIranianIraqiIrishIroquoisIsraeliItalianJamaicanJapaneseJordanianKenyanKiowaKoreanLaotianLatvianLebaneseLiberianLithuanianLumbeeLuxembourgerMacedonianMalaysianMalteseMarshalleseMenomineeMexicanMexican American IndianMongolianMoroccanNative HawaiianNavajoNepaleseNew ZealanderNicaraguanNigerianNorthern EuropeanNorwegianOkinawanOsageOttawaPaiutePakistaniPalestinianPanamanianParaguayanPennsylvania GermanPeruvianPimaPolishPortuguesePotawatomiPuebloPuerto RicanPuget Sound SalishRomanianRussianSalvadoranSamoanScandinavianScotch-IrishScottishSeminoleSenegaleseSerbianShoshoneSierra LeoneanSiouxSlavicSlovakSloveneSomaliSouth AfricanSouth AmericanSouth American IndianSoviet UnionSpaniardSpanishSpanish AmericanSpanish American IndianSri LankanSubsaharan AfricanSudaneseSwedishSwissSyrianTaiwaneseThaiTlingit-HaidaTohono O'OdhamTonganTrinidadian and TobagonianTsimshianTurkishU.S. Virgin IslanderUgandanUkrainianUruguayanUteVenezuelanVietnameseWelshWest IndianYakamaYaquiYugoslavianYumanYup'ikZimbabwean
Immigration
NonimmigrantsImmigrantsAfghanistanAfricaAlbaniaArgentinaArmeniaAsiaAustraliaAustriaBahamasBangladeshBarbadosBelarusBelgiumBelizeBoliviaBosnia and HerzegovinaBrazilBulgariaBurma/MyanmarCabo VerdeCambodiaCameroonCanadaCaribbeanCentral AmericaChileChinaColombiaCongoCosta RicaCroatiaCubaCzechoslovakiaDenmarkDominicaDominican RepublicEastern AfricaEastern AsiaEastern EuropeEcuadorEgyptEl SalvadorEnglandEritreaEthiopiaEuropeFijiFranceGermanyGhanaGreeceGrenadaGuatemalaGuyanaHaitiHondurasHong KongHungaryIndiaIndonesiaIranIraqIrelandIsraelItalyJamaicaJapanJordanKazakhstanKenyaKoreaKuwaitLaosLatin AmericaLatviaLebanonLiberiaLithuaniaMalaysiaMexicoMicronesiaMiddle AfricaMoldovaMoroccoNepalNetherlandsNicaraguaNigeriaNorth AmericaNorth MacedoniaNorthern AfricaNorthern EuropeNorwayOceaniaPakistanPanamaPeruPhilippinesPolandPortugalRomaniaRussiaSaudi ArabiaScotlandSenegalSerbiaSierra LeoneSingaporeSomaliaSouth AfricaSouth AmericaSouth Central AsiaSouth Eastern AsiaSouthern EuropeSpainSri LankaSt. Vincent and the GrenadinesSudanSwedenSwitzerlandSyriaTaiwanThailandTrinidad and TobagoTurkeyUgandaUkraineUruguayUzbekistanVenezuelaVietnamWest IndiesWestern AfricaWestern AsiaWestern EuropeYemenZaireZimbabweAzores
Select to Compare
Race
Ancestry
AfghanAfricanAlaska NativeAlaskan AthabascanAlbanianAleutAlsatianAmericanApacheArapahoArgentineanArmenianAssyrian/Chaldean/SyriacAustralianAustrianBahamianBangladeshiBarbadianBasqueBelgianBelizeanBermudanBhutaneseBlackfeetBolivianBrazilianBritishBritish West IndianBulgarianBurmeseCajunCambodianCanadianCape VerdeanCarpatho RusynCelticCentral AmericanCentral American IndianCherokeeCheyenneChickasawChileanChineseChippewaChoctawColombianColvilleComancheCosta RicanCreeCreekCroatianCrowCubanCypriotCzechCzechoslovakianDanishDelawareDominicanDutchDutch West IndianEastern EuropeanEcuadorianEgyptianEnglishEstonianEthiopianEuropeanFijianFilipinoFinnishFrenchFrench American IndianFrench CanadianGermanGerman RussianGhanaianGreekGuamanian/ChamorroGuatemalanGuyaneseHaitianHmongHonduranHopiHoumaHungarianIcelanderIndian (Asian)IndonesianInupiatIranianIraqiIrishIroquoisIsraeliItalianJamaicanJapaneseJordanianKenyanKiowaKoreanLaotianLatvianLebaneseLiberianLithuanianLumbeeLuxembourgerMacedonianMalaysianMalteseMarshalleseMenomineeMexicanMexican American IndianMongolianMoroccanNative HawaiianNavajoNepaleseNew ZealanderNicaraguanNigerianNorthern EuropeanNorwegianOkinawanOsageOttawaPaiutePakistaniPalestinianPanamanianParaguayanPennsylvania GermanPeruvianPimaPolishPortuguesePotawatomiPuebloPuerto RicanPuget Sound SalishRomanianRussianSalvadoranSamoanScandinavianScotch-IrishScottishSeminoleSenegaleseSerbianShoshoneSierra LeoneanSiouxSlavicSlovakSloveneSomaliSouth AfricanSouth AmericanSouth American IndianSoviet UnionSpaniardSpanishSpanish AmericanSpanish American IndianSri LankanSubsaharan AfricanSudaneseSwedishSwissSyrianTaiwaneseThaiTlingit-HaidaTohono O'OdhamTonganTrinidadian and TobagonianTsimshianTurkishU.S. Virgin IslanderUgandanUkrainianUruguayanUteVenezuelanVietnameseWelshWest IndianYakamaYaquiYugoslavianYumanYup'ikZimbabwean
Immigration
NonimmigrantsImmigrantsAfghanistanAfricaAlbaniaArgentinaArmeniaAsiaAustraliaAustriaBahamasBangladeshBarbadosBelarusBelgiumBelizeBoliviaBosnia and HerzegovinaBrazilBulgariaBurma/MyanmarCabo VerdeCambodiaCameroonCanadaCaribbeanCentral AmericaChileChinaColombiaCongoCosta RicaCroatiaCubaCzechoslovakiaDenmarkDominicaDominican RepublicEastern AfricaEastern AsiaEastern EuropeEcuadorEgyptEl SalvadorEnglandEritreaEthiopiaEuropeFijiFranceGermanyGhanaGreeceGrenadaGuatemalaGuyanaHaitiHondurasHong KongHungaryIndiaIndonesiaIranIraqIrelandIsraelItalyJamaicaJapanJordanKazakhstanKenyaKoreaKuwaitLaosLatin AmericaLatviaLebanonLiberiaLithuaniaMalaysiaMexicoMicronesiaMiddle AfricaMoldovaMoroccoNepalNetherlandsNicaraguaNigeriaNorth AmericaNorth MacedoniaNorthern AfricaNorthern EuropeNorwayOceaniaPakistanPanamaPeruPhilippinesPolandPortugalRomaniaRussiaSaudi ArabiaScotlandSenegalSerbiaSierra LeoneSingaporeSomaliaSouth AfricaSouth AmericaSouth Central AsiaSouth Eastern AsiaSouthern EuropeSpainSri LankaSt. Vincent and the GrenadinesSudanSwedenSwitzerlandSyriaTaiwanThailandTrinidad and TobagoTurkeyUgandaUkraineUruguayUzbekistanVenezuelaVietnamWest IndiesWestern AfricaWestern AsiaWestern EuropeYemenZaireZimbabweAzores
Disability Age 5 to 17
Income
Poverty
Unemployment
Labor Participation
Family Structure
Vehicle Availability
Education Level
Disability

Arab Disability Age 5 to 17
Exceptional

5.4%
DISABILITY | AGE 5 TO 17
92.9/ 100
METRIC RATING
131st/ 347
METRIC RANK

Arab Disability Age 5 to 17 Correlation Chart

The statistical analysis conducted on geographies consisting of 481,041,182 people shows no correlation between the proportion of Arabs and percentage of population with a disability between the ages 5 and 17 in the United States with a correlation coefficient (R) of 0.008 and weighted average of 5.4%. On average, for every 1% (one percent) increase in Arabs within a typical geography, there is an increase of 0.0040% in percentage of population with a disability between the ages 5 and 17.
Arab Disability Age 5 to 17
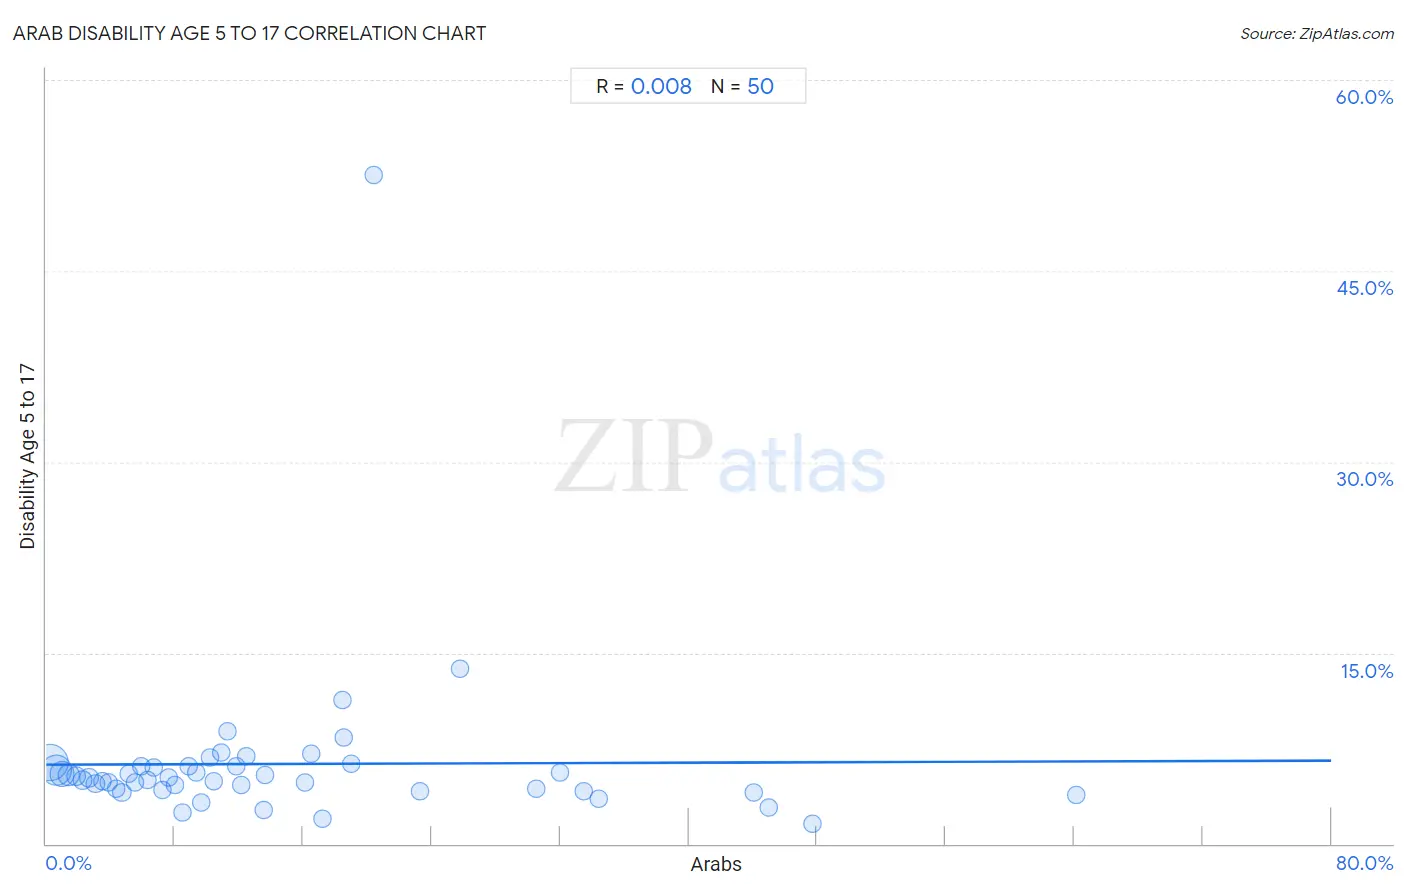
It is essential to understand that the correlation between the percentage of Arabs and percentage of population with a disability between the ages 5 and 17 does not imply a direct cause-and-effect relationship. It remains uncertain whether the presence of Arabs influences an upward or downward trend in the level of percentage of population with a disability between the ages 5 and 17 within an area, or if Arabs simply ended up residing in those areas with higher or lower levels of percentage of population with a disability between the ages 5 and 17 due to other factors.

Demographics Similar to Arabs by Disability Age 5 to 17

In terms of disability age 5 to 17, the demographic groups most similar to Arabs are Immigrants from Colombia (5.4%, a difference of 0.020%), Venezuelan (5.4%, a difference of 0.050%), Yuman (5.4%, a difference of 0.13%), Immigrants from Belize (5.4%, a difference of 0.22%), and Immigrants from Bulgaria (5.4%, a difference of 0.23%).
DemographicsRating | RankDisability Age 5 to 17
Crow
95.0
/100
|
#124
Exceptional
5.4%
Immigrants from Chile
95.0
/100
|
#125
Exceptional
5.4%
New Zealanders
95.0
/100
|
#126
Exceptional
5.4%
Latvians
95.0
/100
|
#127
Exceptional
5.4%
Immigrants from Venezuela
94.5
/100
|
#128
Exceptional
5.4%
Romanians
94.1
/100
|
#129
Exceptional
5.4%
Immigrants from Bulgaria
94.0
/100
|
#130
Exceptional
5.4%
Arabs
92.9
/100
|
#131
Exceptional
5.4%
Immigrants from Colombia
92.9
/100
|
#132
Exceptional
5.4%
Venezuelans
92.7
/100
|
#133
Exceptional
5.4%
Yuman
92.3
/100
|
#134
Exceptional
5.4%
Immigrants from Belize
91.7
/100
|
#135
Exceptional
5.4%
Immigrants from Denmark
91.4
/100
|
#136
Exceptional
5.4%
Navajo
90.9
/100
|
#137
Exceptional
5.4%
Immigrants from Oceania
90.8
/100
|
#138
Exceptional
5.4%

Arab Disability Age 5 to 17 Correlation Summary

MeasurementArab DataDisability Age 5 to 17 Data
Minimum0.20%1.6%
Maximum64.1%52.5%
Range63.9%50.9%
Mean14.6%6.3%
Median10.3%5.1%
Interquartile 25% (IQ1)5.1%4.2%
Interquartile 75% (IQ3)18.5%6.1%
Interquartile Range (IQR)13.4%1.9%
Standard Deviation (Sample)13.9%7.0%
Standard Deviation (Population)13.8%6.9%

Correlation Details

Arab PercentileSample SizeDisability Age 5 to 17
[
0.0%
-
0.5%
]
0.20%
195,195,6276.4%
[
0.5%
-
1.0%
]
0.61%
126,863,7255.7%
[
0.5%
-
1.0%
]
1.00%
73,274,7565.5%
[
1.0%
-
1.5%
]
1.39%
38,944,6745.4%
[
1.5%
-
2.0%
]
1.84%
15,711,7355.3%
[
2.0%
-
2.5%
]
2.24%
11,025,7535.0%
[
2.5%
-
3.0%
]
2.67%
6,729,9925.2%
[
3.0%
-
3.5%
]
3.06%
3,231,3714.7%
[
3.5%
-
4.0%
]
3.50%
2,022,1254.9%
[
3.5%
-
4.0%
]
3.87%
2,114,1134.8%
[
4.0%
-
4.5%
]
4.32%
928,9914.4%
[
4.5%
-
5.0%
]
4.71%
816,1464.0%
[
5.0%
-
5.5%
]
5.12%
675,5655.5%
[
5.5%
-
6.0%
]
5.55%
425,5924.8%
[
5.5%
-
6.0%
]
5.92%
218,6746.1%
[
6.0%
-
6.5%
]
6.31%
408,0375.0%
[
6.5%
-
7.0%
]
6.67%
275,7376.0%
[
7.0%
-
7.5%
]
7.25%
134,0344.2%
[
7.5%
-
8.0%
]
7.64%
272,0205.2%
[
7.5%
-
8.0%
]
7.99%
192,2344.6%
[
8.0%
-
8.5%
]
8.50%
79,6782.4%
[
8.5%
-
9.0%
]
8.86%
320,7536.1%
[
9.0%
-
9.5%
]
9.37%
29,7995.6%
[
9.5%
-
10.0%
]
9.62%
85,8173.2%
[
10.0%
-
10.5%
]
10.18%
50,7376.8%
[
10.0%
-
10.5%
]
10.42%
96,7494.9%
[
10.5%
-
11.0%
]
10.90%
127,8727.2%
[
11.0%
-
11.5%
]
11.30%
142,1268.8%
[
11.5%
-
12.0%
]
11.83%
46,9796.1%
[
12.0%
-
12.5%
]
12.13%
37,8684.6%
[
12.0%
-
12.5%
]
12.43%
22,0826.8%
[
13.5%
-
14.0%
]
13.53%
35,5332.6%
[
13.5%
-
14.0%
]
13.60%
72,8095.4%
[
16.0%
-
16.5%
]
16.13%
34,0464.8%
[
16.5%
-
17.0%
]
16.52%
1,1327.0%
[
17.0%
-
17.5%
]
17.22%
25,2782.0%
[
18.0%
-
18.5%
]
18.45%
64511.3%
[
18.5%
-
19.0%
]
18.52%
548.3%
[
18.5%
-
19.0%
]
19.00%
7,5706.3%
[
20.0%
-
20.5%
]
20.38%
21152.5%
[
23.0%
-
23.5%
]
23.30%
43,2134.1%
[
25.5%
-
26.0%
]
25.80%
31413.8%
[
30.5%
-
31.0%
]
30.52%
27,8424.3%
[
31.5%
-
32.0%
]
32.00%
12,4055.6%
[
33.0%
-
33.5%
]
33.47%
62,4744.2%
[
34.0%
-
34.5%
]
34.38%
5,5263.5%
[
44.0%
-
44.5%
]
44.01%
108,4144.1%
[
44.5%
-
45.0%
]
44.98%
40,3922.9%
[
47.5%
-
48.0%
]
47.71%
8,9191.6%
[
64.0%
-
64.5%
]
64.10%
53,0443.8%