Indian (Asian) Disability Age 5 to 17
COMPARE
Indian (Asian)
Select to Compare
Disability Age 5 to 17
Indian (Asian) Disability Age 5 to 17
4.6%
DISABILITY | AGE 5 TO 17
100.0/ 100
METRIC RATING
8th/ 347
METRIC RANK
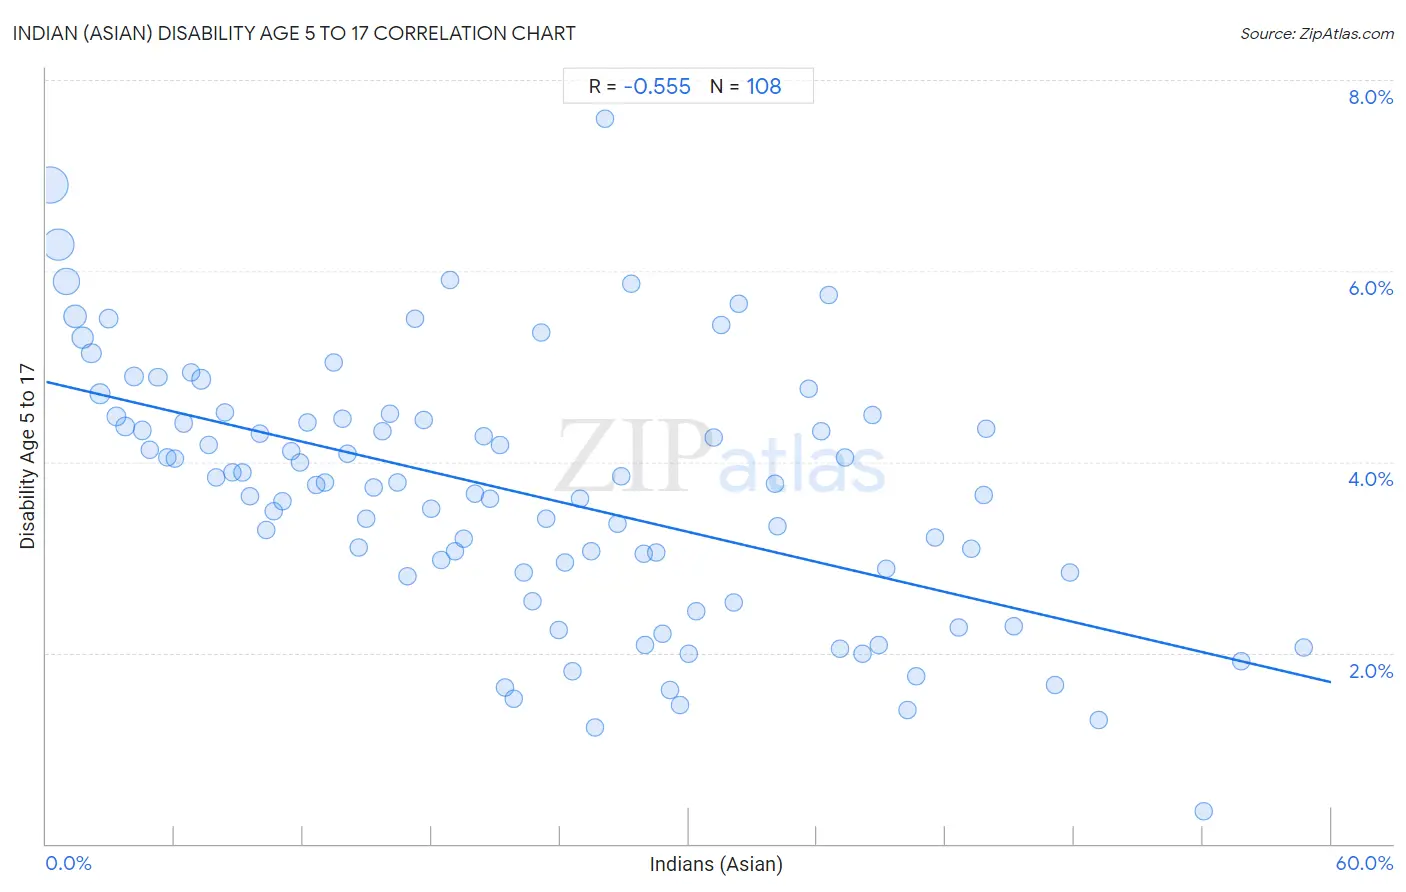
Indian (Asian) Disability Age 5 to 17 Correlation Chart
The statistical analysis conducted on geographies consisting of 488,980,607 people shows a substantial negative correlation between the proportion of Indians (Asian) and percentage of population with a disability between the ages 5 and 17 in the United States with a correlation coefficient (R) of -0.555 and weighted average of 4.6%. On average, for every 1% (one percent) increase in Indians (Asian) within a typical geography, there is a decrease of 0.052% in percentage of population with a disability between the ages 5 and 17.
It is essential to understand that the correlation between the percentage of Indians (Asian) and percentage of population with a disability between the ages 5 and 17 does not imply a direct cause-and-effect relationship. It remains uncertain whether the presence of Indians (Asian) influences an upward or downward trend in the level of percentage of population with a disability between the ages 5 and 17 within an area, or if Indians (Asian) simply ended up residing in those areas with higher or lower levels of percentage of population with a disability between the ages 5 and 17 due to other factors.
Demographics Similar to Indians (Asian) by Disability Age 5 to 17
In terms of disability age 5 to 17, the demographic groups most similar to Indians (Asian) are Immigrants from Eastern Asia (4.6%, a difference of 0.33%), Immigrants from India (4.6%, a difference of 0.40%), Armenian (4.6%, a difference of 0.56%), Iranian (4.6%, a difference of 0.80%), and Immigrants from China (4.5%, a difference of 0.93%).
| Demographics | Rating | Rank | Disability Age 5 to 17 |
| Immigrants from Armenia | 100.0 /100 | #1 | Exceptional 4.1% |
| Immigrants from Taiwan | 100.0 /100 | #2 | Exceptional 4.2% |
| Immigrants from Hong Kong | 100.0 /100 | #3 | Exceptional 4.3% |
| Filipinos | 100.0 /100 | #4 | Exceptional 4.3% |
| Immigrants from Iran | 100.0 /100 | #5 | Exceptional 4.4% |
| Immigrants from Israel | 100.0 /100 | #6 | Exceptional 4.5% |
| Immigrants from China | 100.0 /100 | #7 | Exceptional 4.5% |
| Indians (Asian) | 100.0 /100 | #8 | Exceptional 4.6% |
| Immigrants from Eastern Asia | 100.0 /100 | #9 | Exceptional 4.6% |
| Immigrants from India | 100.0 /100 | #10 | Exceptional 4.6% |
| Armenians | 100.0 /100 | #11 | Exceptional 4.6% |
| Iranians | 100.0 /100 | #12 | Exceptional 4.6% |
| Thais | 100.0 /100 | #13 | Exceptional 4.7% |
| Immigrants from Korea | 100.0 /100 | #14 | Exceptional 4.7% |
| Chinese | 100.0 /100 | #15 | Exceptional 4.7% |
Indian (Asian) Disability Age 5 to 17 Correlation Summary
| Measurement | Indian (Asian) Data | Disability Age 5 to 17 Data |
| Minimum | 0.19% | 0.35% |
| Maximum | 58.7% | 7.6% |
| Range | 58.5% | 7.3% |
| Mean | 22.2% | 3.7% |
| Median | 21.0% | 3.8% |
| Interquartile 25% (IQ1) | 10.5% | 2.8% |
| Interquartile 75% (IQ3) | 31.8% | 4.4% |
| Interquartile Range (IQR) | 21.4% | 1.6% |
| Standard Deviation (Sample) | 14.2% | 1.3% |
| Standard Deviation (Population) | 14.1% | 1.3% |
Correlation Details
| Indian (Asian) Percentile | Sample Size | Disability Age 5 to 17 |
[ 0.0% - 0.5% ] 0.19% | 139,002,969 | 6.9% |
[ 0.5% - 1.0% ] 0.57% | 107,150,189 | 6.3% |
[ 0.5% - 1.0% ] 0.95% | 62,127,471 | 5.9% |
[ 1.0% - 1.5% ] 1.34% | 35,691,414 | 5.5% |
[ 1.5% - 2.0% ] 1.72% | 25,626,691 | 5.3% |
[ 2.0% - 2.5% ] 2.11% | 17,262,494 | 5.1% |
[ 2.5% - 3.0% ] 2.51% | 17,922,480 | 4.7% |
[ 2.5% - 3.0% ] 2.91% | 11,301,394 | 5.5% |
[ 3.0% - 3.5% ] 3.29% | 6,836,459 | 4.5% |
[ 3.5% - 4.0% ] 3.67% | 5,810,391 | 4.4% |
[ 4.0% - 4.5% ] 4.08% | 5,747,286 | 4.9% |
[ 4.0% - 4.5% ] 4.48% | 3,318,917 | 4.3% |
[ 4.5% - 5.0% ] 4.83% | 3,202,978 | 4.1% |
[ 5.0% - 5.5% ] 5.22% | 4,044,136 | 4.9% |
[ 5.5% - 6.0% ] 5.64% | 2,305,763 | 4.1% |
[ 5.5% - 6.0% ] 6.00% | 2,174,628 | 4.0% |
[ 6.0% - 6.5% ] 6.42% | 1,607,025 | 4.4% |
[ 6.5% - 7.0% ] 6.77% | 1,838,490 | 4.9% |
[ 7.0% - 7.5% ] 7.25% | 10,841,857 | 4.9% |
[ 7.5% - 8.0% ] 7.61% | 1,052,050 | 4.2% |
[ 7.5% - 8.0% ] 7.94% | 1,243,654 | 3.8% |
[ 8.0% - 8.5% ] 8.34% | 1,252,554 | 4.5% |
[ 8.5% - 9.0% ] 8.71% | 1,869,647 | 3.9% |
[ 9.0% - 9.5% ] 9.15% | 699,879 | 3.9% |
[ 9.5% - 10.0% ] 9.51% | 733,241 | 3.6% |
[ 9.5% - 10.0% ] 9.99% | 1,414,900 | 4.3% |
[ 10.0% - 10.5% ] 10.30% | 407,323 | 3.3% |
[ 10.5% - 11.0% ] 10.62% | 407,106 | 3.5% |
[ 11.0% - 11.5% ] 11.04% | 681,089 | 3.6% |
[ 11.0% - 11.5% ] 11.44% | 553,245 | 4.1% |
[ 11.5% - 12.0% ] 11.85% | 689,588 | 4.0% |
[ 12.0% - 12.5% ] 12.19% | 702,145 | 4.4% |
[ 12.5% - 13.0% ] 12.63% | 669,480 | 3.8% |
[ 13.0% - 13.5% ] 13.00% | 440,087 | 3.8% |
[ 13.0% - 13.5% ] 13.42% | 227,972 | 5.0% |
[ 13.5% - 14.0% ] 13.81% | 336,115 | 4.5% |
[ 14.0% - 14.5% ] 14.09% | 551,399 | 4.1% |
[ 14.5% - 15.0% ] 14.60% | 192,263 | 3.1% |
[ 14.5% - 15.0% ] 14.93% | 450,820 | 3.4% |
[ 15.0% - 15.5% ] 15.27% | 745,160 | 3.7% |
[ 15.5% - 16.0% ] 15.71% | 460,901 | 4.3% |
[ 16.0% - 16.5% ] 16.08% | 274,809 | 4.5% |
[ 16.0% - 16.5% ] 16.40% | 515,007 | 3.8% |
[ 16.5% - 17.0% ] 16.89% | 407,251 | 2.8% |
[ 17.0% - 17.5% ] 17.21% | 102,332 | 5.5% |
[ 17.5% - 18.0% ] 17.63% | 331,022 | 4.4% |
[ 17.5% - 18.0% ] 17.97% | 632,061 | 3.5% |
[ 18.0% - 18.5% ] 18.43% | 522,986 | 3.0% |
[ 18.5% - 19.0% ] 18.87% | 322,667 | 5.9% |
[ 19.0% - 19.5% ] 19.11% | 110,633 | 3.1% |
[ 19.0% - 19.5% ] 19.48% | 318,655 | 3.2% |
[ 20.0% - 20.5% ] 20.02% | 795,403 | 3.7% |
[ 20.0% - 20.5% ] 20.43% | 106,130 | 4.3% |
[ 20.5% - 21.0% ] 20.74% | 236,857 | 3.6% |
[ 21.0% - 21.5% ] 21.21% | 68,392 | 4.2% |
[ 21.0% - 21.5% ] 21.41% | 203,886 | 1.6% |
[ 21.5% - 22.0% ] 21.85% | 64,946 | 1.5% |
[ 22.0% - 22.5% ] 22.30% | 74,356 | 2.8% |
[ 22.5% - 23.0% ] 22.71% | 131,426 | 2.5% |
[ 23.0% - 23.5% ] 23.09% | 144,601 | 5.4% |
[ 23.0% - 23.5% ] 23.36% | 862,624 | 3.4% |
[ 23.5% - 24.0% ] 23.95% | 60,815 | 2.2% |
[ 24.0% - 24.5% ] 24.23% | 181,482 | 2.9% |
[ 24.5% - 25.0% ] 24.58% | 45,466 | 1.8% |
[ 24.5% - 25.0% ] 24.93% | 8,755 | 3.6% |
[ 25.0% - 25.5% ] 25.46% | 58,529 | 3.1% |
[ 25.5% - 26.0% ] 25.62% | 91,833 | 1.2% |
[ 26.0% - 26.5% ] 26.11% | 23,343 | 7.6% |
[ 26.5% - 27.0% ] 26.69% | 50,734 | 3.4% |
[ 26.5% - 27.0% ] 26.85% | 88,531 | 3.9% |
[ 27.0% - 27.5% ] 27.32% | 29,394 | 5.9% |
[ 27.5% - 28.0% ] 27.87% | 124,609 | 3.0% |
[ 27.5% - 28.0% ] 27.93% | 52,707 | 2.1% |
[ 28.0% - 28.5% ] 28.48% | 102,432 | 3.0% |
[ 28.5% - 29.0% ] 28.77% | 46,424 | 2.2% |
[ 29.0% - 29.5% ] 29.10% | 114,878 | 1.6% |
[ 29.5% - 30.0% ] 29.57% | 89,911 | 1.5% |
[ 29.5% - 30.0% ] 29.99% | 90,534 | 2.0% |
[ 30.0% - 30.5% ] 30.33% | 90,796 | 2.4% |
[ 31.0% - 31.5% ] 31.18% | 19,928 | 4.2% |
[ 31.5% - 32.0% ] 31.53% | 48,930 | 5.4% |
[ 32.0% - 32.5% ] 32.10% | 38,554 | 2.5% |
[ 32.0% - 32.5% ] 32.32% | 98,730 | 5.7% |
[ 34.0% - 34.5% ] 34.02% | 135,971 | 3.8% |
[ 34.0% - 34.5% ] 34.14% | 43,304 | 3.3% |
[ 35.5% - 36.0% ] 35.63% | 80,880 | 4.8% |
[ 36.0% - 36.5% ] 36.18% | 65,922 | 4.3% |
[ 36.5% - 37.0% ] 36.54% | 31,986 | 5.7% |
[ 37.0% - 37.5% ] 37.05% | 61,592 | 2.0% |
[ 37.0% - 37.5% ] 37.29% | 140,600 | 4.0% |
[ 38.0% - 38.5% ] 38.11% | 129,504 | 2.0% |
[ 38.5% - 39.0% ] 38.57% | 109,501 | 4.5% |
[ 38.5% - 39.0% ] 38.86% | 85,228 | 2.1% |
[ 39.0% - 39.5% ] 39.20% | 7,786 | 2.9% |
[ 40.0% - 40.5% ] 40.24% | 22,654 | 1.4% |
[ 40.5% - 41.0% ] 40.62% | 28,212 | 1.8% |
[ 41.5% - 42.0% ] 41.51% | 33,937 | 3.2% |
[ 42.5% - 43.0% ] 42.62% | 60,364 | 2.3% |
[ 43.0% - 43.5% ] 43.21% | 83,114 | 3.1% |
[ 43.5% - 44.0% ] 43.76% | 91,781 | 3.7% |
[ 43.5% - 44.0% ] 43.92% | 25,460 | 4.4% |
[ 45.0% - 45.5% ] 45.16% | 37,340 | 2.3% |
[ 47.0% - 47.5% ] 47.13% | 89,536 | 1.7% |
[ 47.5% - 48.0% ] 47.80% | 95,942 | 2.8% |
[ 49.0% - 49.5% ] 49.15% | 12,070 | 1.3% |
[ 54.0% - 54.5% ] 54.04% | 25,001 | 0.35% |
[ 55.5% - 56.0% ] 55.81% | 26,418 | 1.9% |
[ 58.5% - 59.0% ] 58.72% | 79,495 | 2.0% |