Tlingit-Haida Single Father Poverty

COMPARE

Tlingit-Haida
Race
Ancestry
AfghanAfricanAlaska NativeAlaskan AthabascanAlbanianAleutAlsatianAmericanApacheArabArapahoArgentineanArmenianAssyrian/Chaldean/SyriacAustralianAustrianBahamianBangladeshiBarbadianBasqueBelgianBelizeanBermudanBhutaneseBlackfeetBolivianBrazilianBritishBritish West IndianBulgarianBurmeseCajunCambodianCanadianCape VerdeanCarpatho RusynCelticCentral AmericanCentral American IndianCherokeeCheyenneChickasawChileanChineseChippewaChoctawColombianColvilleComancheCosta RicanCreeCreekCroatianCrowCubanCypriotCzechCzechoslovakianDanishDelawareDominicanDutchDutch West IndianEastern EuropeanEcuadorianEgyptianEnglishEstonianEthiopianEuropeanFijianFilipinoFinnishFrenchFrench American IndianFrench CanadianGermanGerman RussianGhanaianGreekGuamanian/ChamorroGuatemalanGuyaneseHaitianHmongHonduranHopiHoumaHungarianIcelanderIndian (Asian)IndonesianInupiatIranianIraqiIrishIroquoisIsraeliItalianJamaicanJapaneseJordanianKenyanKiowaKoreanLaotianLatvianLebaneseLiberianLithuanianLumbeeLuxembourgerMacedonianMalaysianMalteseMarshalleseMenomineeMexicanMexican American IndianMongolianMoroccanNative HawaiianNavajoNepaleseNew ZealanderNicaraguanNigerianNorthern EuropeanNorwegianOkinawanOsageOttawaPaiutePakistaniPalestinianPanamanianParaguayanPennsylvania GermanPeruvianPimaPolishPortuguesePotawatomiPuebloPuerto RicanPuget Sound SalishRomanianRussianSalvadoranSamoanScandinavianScotch-IrishScottishSeminoleSenegaleseSerbianShoshoneSierra LeoneanSiouxSlavicSlovakSloveneSomaliSouth AfricanSouth AmericanSouth American IndianSoviet UnionSpaniardSpanishSpanish AmericanSpanish American IndianSri LankanSubsaharan AfricanSudaneseSwedishSwissSyrianTaiwaneseThaiTlingit-HaidaTohono O'OdhamTonganTrinidadian and TobagonianTsimshianTurkishU.S. Virgin IslanderUgandanUkrainianUruguayanUteVenezuelanVietnameseWelshWest IndianYakamaYaquiYugoslavianYumanYup'ikZimbabwean
Immigration
NonimmigrantsImmigrantsAfghanistanAfricaAlbaniaArgentinaArmeniaAsiaAustraliaAustriaBahamasBangladeshBarbadosBelarusBelgiumBelizeBoliviaBosnia and HerzegovinaBrazilBulgariaBurma/MyanmarCabo VerdeCambodiaCameroonCanadaCaribbeanCentral AmericaChileChinaColombiaCongoCosta RicaCroatiaCubaCzechoslovakiaDenmarkDominicaDominican RepublicEastern AfricaEastern AsiaEastern EuropeEcuadorEgyptEl SalvadorEnglandEritreaEthiopiaEuropeFijiFranceGermanyGhanaGreeceGrenadaGuatemalaGuyanaHaitiHondurasHong KongHungaryIndiaIndonesiaIranIraqIrelandIsraelItalyJamaicaJapanJordanKazakhstanKenyaKoreaKuwaitLaosLatin AmericaLatviaLebanonLiberiaLithuaniaMalaysiaMexicoMicronesiaMiddle AfricaMoldovaMoroccoNepalNetherlandsNicaraguaNigeriaNorth AmericaNorth MacedoniaNorthern AfricaNorthern EuropeNorwayOceaniaPakistanPanamaPeruPhilippinesPolandPortugalRomaniaRussiaSaudi ArabiaScotlandSenegalSerbiaSierra LeoneSingaporeSomaliaSouth AfricaSouth AmericaSouth Central AsiaSouth Eastern AsiaSouthern EuropeSpainSri LankaSt. Vincent and the GrenadinesSudanSwedenSwitzerlandSyriaTaiwanThailandTrinidad and TobagoTurkeyUgandaUkraineUruguayUzbekistanVenezuelaVietnamWest IndiesWestern AfricaWestern AsiaWestern EuropeYemenZaireZimbabweAzores
Select to Compare
Race
Ancestry
AfghanAfricanAlaska NativeAlaskan AthabascanAlbanianAleutAlsatianAmericanApacheArabArapahoArgentineanArmenianAssyrian/Chaldean/SyriacAustralianAustrianBahamianBangladeshiBarbadianBasqueBelgianBelizeanBermudanBhutaneseBlackfeetBolivianBrazilianBritishBritish West IndianBulgarianBurmeseCajunCambodianCanadianCape VerdeanCarpatho RusynCelticCentral AmericanCentral American IndianCherokeeCheyenneChickasawChileanChineseChippewaChoctawColombianColvilleComancheCosta RicanCreeCreekCroatianCrowCubanCypriotCzechCzechoslovakianDanishDelawareDominicanDutchDutch West IndianEastern EuropeanEcuadorianEgyptianEnglishEstonianEthiopianEuropeanFijianFilipinoFinnishFrenchFrench American IndianFrench CanadianGermanGerman RussianGhanaianGreekGuamanian/ChamorroGuatemalanGuyaneseHaitianHmongHonduranHopiHoumaHungarianIcelanderIndian (Asian)IndonesianInupiatIranianIraqiIrishIroquoisIsraeliItalianJamaicanJapaneseJordanianKenyanKiowaKoreanLaotianLatvianLebaneseLiberianLithuanianLumbeeLuxembourgerMacedonianMalaysianMalteseMarshalleseMenomineeMexicanMexican American IndianMongolianMoroccanNative HawaiianNavajoNepaleseNew ZealanderNicaraguanNigerianNorthern EuropeanNorwegianOkinawanOsageOttawaPaiutePakistaniPalestinianPanamanianParaguayanPennsylvania GermanPeruvianPimaPolishPortuguesePotawatomiPuebloPuerto RicanPuget Sound SalishRomanianRussianSalvadoranSamoanScandinavianScotch-IrishScottishSeminoleSenegaleseSerbianShoshoneSierra LeoneanSiouxSlavicSlovakSloveneSomaliSouth AfricanSouth AmericanSouth American IndianSoviet UnionSpaniardSpanishSpanish AmericanSpanish American IndianSri LankanSubsaharan AfricanSudaneseSwedishSwissSyrianTaiwaneseThaiTohono O'OdhamTonganTrinidadian and TobagonianTsimshianTurkishU.S. Virgin IslanderUgandanUkrainianUruguayanUteVenezuelanVietnameseWelshWest IndianYakamaYaquiYugoslavianYumanYup'ikZimbabwean
Immigration
NonimmigrantsImmigrantsAfghanistanAfricaAlbaniaArgentinaArmeniaAsiaAustraliaAustriaBahamasBangladeshBarbadosBelarusBelgiumBelizeBoliviaBosnia and HerzegovinaBrazilBulgariaBurma/MyanmarCabo VerdeCambodiaCameroonCanadaCaribbeanCentral AmericaChileChinaColombiaCongoCosta RicaCroatiaCubaCzechoslovakiaDenmarkDominicaDominican RepublicEastern AfricaEastern AsiaEastern EuropeEcuadorEgyptEl SalvadorEnglandEritreaEthiopiaEuropeFijiFranceGermanyGhanaGreeceGrenadaGuatemalaGuyanaHaitiHondurasHong KongHungaryIndiaIndonesiaIranIraqIrelandIsraelItalyJamaicaJapanJordanKazakhstanKenyaKoreaKuwaitLaosLatin AmericaLatviaLebanonLiberiaLithuaniaMalaysiaMexicoMicronesiaMiddle AfricaMoldovaMoroccoNepalNetherlandsNicaraguaNigeriaNorth AmericaNorth MacedoniaNorthern AfricaNorthern EuropeNorwayOceaniaPakistanPanamaPeruPhilippinesPolandPortugalRomaniaRussiaSaudi ArabiaScotlandSenegalSerbiaSierra LeoneSingaporeSomaliaSouth AfricaSouth AmericaSouth Central AsiaSouth Eastern AsiaSouthern EuropeSpainSri LankaSt. Vincent and the GrenadinesSudanSwedenSwitzerlandSyriaTaiwanThailandTrinidad and TobagoTurkeyUgandaUkraineUruguayUzbekistanVenezuelaVietnamWest IndiesWestern AfricaWestern AsiaWestern EuropeYemenZaireZimbabweAzores
Single Father Poverty
Income
Poverty
Unemployment
Labor Participation
Family Structure
Vehicle Availability
Education Level
Disability

Tlingit-Haida Single Father Poverty
Exceptional

15.3%
POVERTY | SINGLE FATHERS
99.5/ 100
METRIC RATING
78th/ 347
METRIC RANK

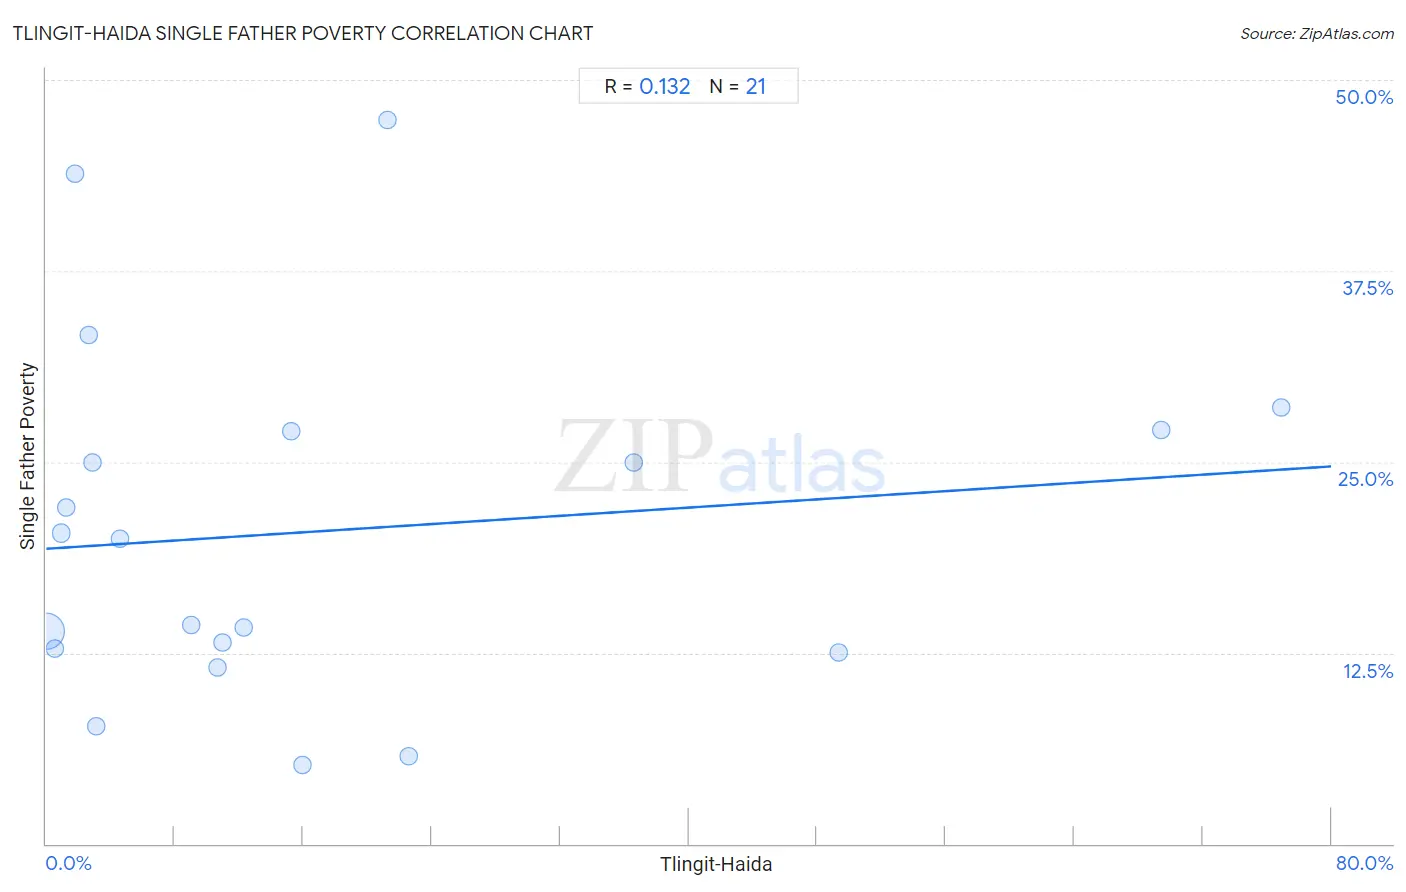
Tlingit-Haida Single Father Poverty Correlation Chart

The statistical analysis conducted on geographies consisting of 55,978,156 people shows a poor positive correlation between the proportion of Tlingit-Haida and poverty level among single fathers in the United States with a correlation coefficient (R) of 0.132 and weighted average of 15.3%. On average, for every 1% (one percent) increase in Tlingit-Haida within a typical geography, there is an increase of 0.067% in poverty level among single fathers.
Tlingit-Haida Single Father Poverty
It is essential to understand that the correlation between the percentage of Tlingit-Haida and poverty level among single fathers does not imply a direct cause-and-effect relationship. It remains uncertain whether the presence of Tlingit-Haida influences an upward or downward trend in the level of poverty level among single fathers within an area, or if Tlingit-Haida simply ended up residing in those areas with higher or lower levels of poverty level among single fathers due to other factors.

Demographics Similar to Tlingit-Haida by Single Father Poverty

In terms of single father poverty, the demographic groups most similar to Tlingit-Haida are Immigrants from Northern Africa (15.3%, a difference of 0.020%), Immigrants from Peru (15.3%, a difference of 0.050%), Immigrants from Japan (15.3%, a difference of 0.060%), Immigrants from Turkey (15.3%, a difference of 0.14%), and Maltese (15.3%, a difference of 0.16%).
DemographicsRating | RankSingle Father Poverty
Immigrants from Brazil
99.6
/100
|
#71
Exceptional
15.3%
Immigrants from Lithuania
99.6
/100
|
#72
Exceptional
15.3%
Kenyans
99.6
/100
|
#73
Exceptional
15.3%
Maltese
99.6
/100
|
#74
Exceptional
15.3%
Immigrants from Turkey
99.5
/100
|
#75
Exceptional
15.3%
Immigrants from Japan
99.5
/100
|
#76
Exceptional
15.3%
Immigrants from Peru
99.5
/100
|
#77
Exceptional
15.3%
Tlingit-Haida
99.5
/100
|
#78
Exceptional
15.3%
Immigrants from Northern Africa
99.5
/100
|
#79
Exceptional
15.3%
Armenians
99.4
/100
|
#80
Exceptional
15.4%
Immigrants from Congo
99.4
/100
|
#81
Exceptional
15.4%
Immigrants from Ukraine
99.4
/100
|
#82
Exceptional
15.4%
Chinese
99.3
/100
|
#83
Exceptional
15.4%
Peruvians
99.2
/100
|
#84
Exceptional
15.4%
Immigrants from Oceania
99.1
/100
|
#85
Exceptional
15.4%

Tlingit-Haida Single Father Poverty Correlation Summary

MeasurementTlingit-Haida DataSingle Father Poverty Data
Minimum0.031%5.1%
Maximum76.8%47.4%
Range76.8%42.2%
Mean17.5%20.5%
Median10.7%20.0%
Interquartile 25% (IQ1)2.2%12.6%
Interquartile 75% (IQ3)21.9%27.1%
Interquartile Range (IQR)19.7%14.4%
Standard Deviation (Sample)22.4%11.5%
Standard Deviation (Population)21.8%11.2%

Correlation Details

Tlingit-Haida PercentileSample SizeSingle Father Poverty
[
0.0%
-
0.5%
]
0.031%
54,794,19913.9%
[
0.5%
-
1.0%
]
0.56%
911,13612.8%
[
0.5%
-
1.0%
]
0.90%
117,18520.3%
[
1.0%
-
1.5%
]
1.22%
42,07722.0%
[
1.5%
-
2.0%
]
1.76%
9,89243.8%
[
2.5%
-
3.0%
]
2.63%
60833.3%
[
2.5%
-
3.0%
]
2.87%
69825.0%
[
3.0%
-
3.5%
]
3.12%
1,2167.7%
[
4.5%
-
5.0%
]
4.62%
82220.0%
[
8.5%
-
9.0%
]
9.00%
6,69114.3%
[
10.5%
-
11.0%
]
10.70%
29,93311.6%
[
11.0%
-
11.5%
]
11.00%
32,10813.2%
[
12.0%
-
12.5%
]
12.26%
18,04114.1%
[
15.0%
-
15.5%
]
15.26%
2,16927.0%
[
15.5%
-
16.0%
]
15.92%
1,7275.1%
[
21.0%
-
21.5%
]
21.23%
4,26747.4%
[
22.5%
-
23.0%
]
22.55%
1,0735.7%
[
36.5%
-
37.0%
]
36.59%
8225.0%
[
49.0%
-
49.5%
]
49.33%
1,79212.5%
[
69.0%
-
69.5%
]
69.41%
1,60227.1%
[
76.5%
-
77.0%
]
76.85%
83828.6%