Tlingit-Haida Disability Age Under 5
COMPARE
Tlingit-Haida
Select to Compare
Disability Age Under 5
Tlingit-Haida Disability Age Under 5
1.5%
DISABILITY | AGE UNDER 5
0.0/ 100
METRIC RATING
286th/ 347
METRIC RANK
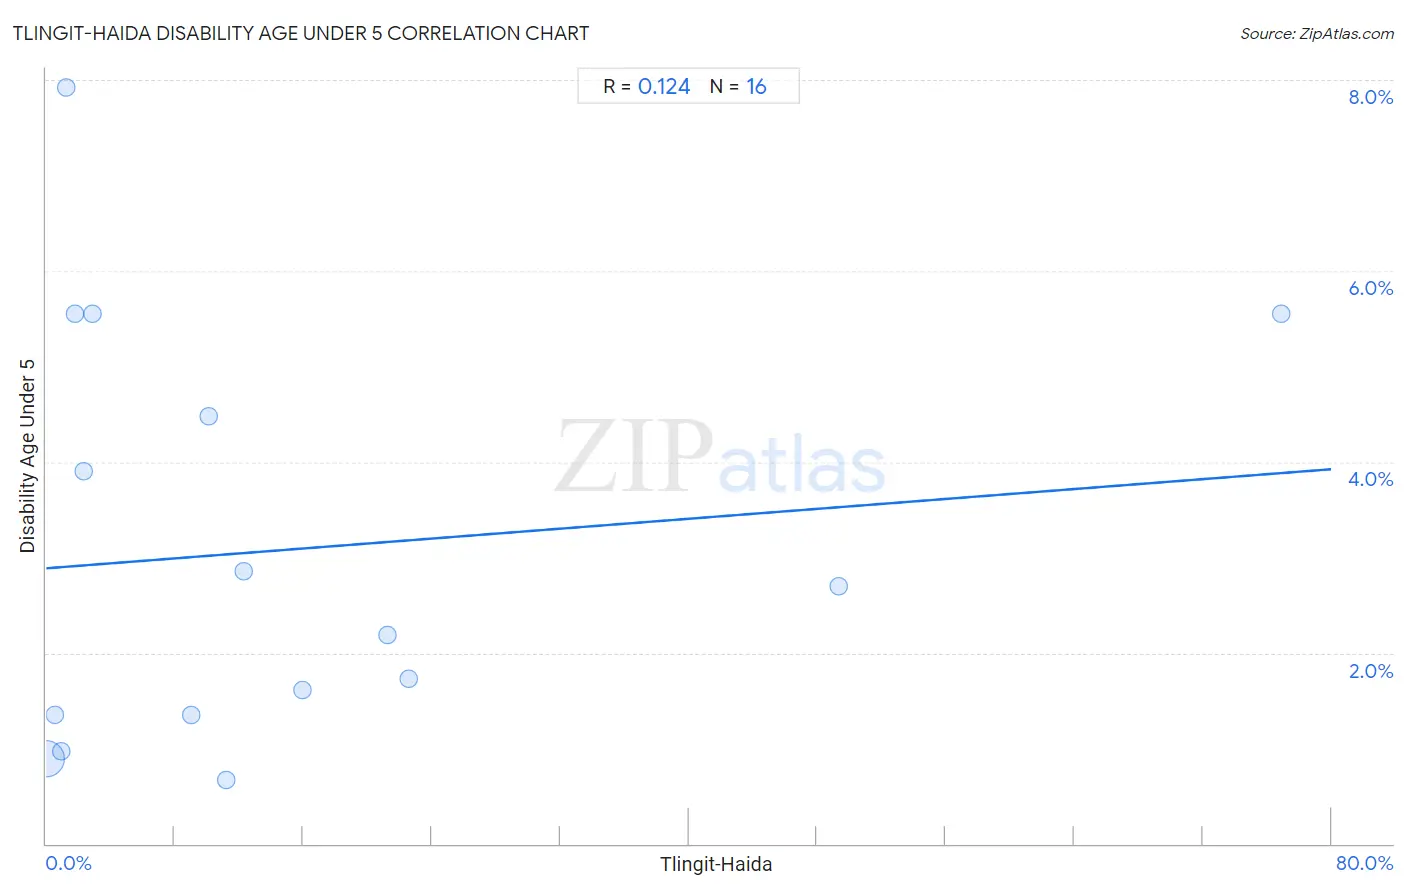
Tlingit-Haida Disability Age Under 5 Correlation Chart
The statistical analysis conducted on geographies consisting of 46,863,169 people shows a poor positive correlation between the proportion of Tlingit-Haida and percentage of population with a disability under the age of 5 in the United States with a correlation coefficient (R) of 0.124 and weighted average of 1.5%. On average, for every 1% (one percent) increase in Tlingit-Haida within a typical geography, there is an increase of 0.013% in percentage of population with a disability under the age of 5.
It is essential to understand that the correlation between the percentage of Tlingit-Haida and percentage of population with a disability under the age of 5 does not imply a direct cause-and-effect relationship. It remains uncertain whether the presence of Tlingit-Haida influences an upward or downward trend in the level of percentage of population with a disability under the age of 5 within an area, or if Tlingit-Haida simply ended up residing in those areas with higher or lower levels of percentage of population with a disability under the age of 5 due to other factors.
Demographics Similar to Tlingit-Haida by Disability Age Under 5
In terms of disability age under 5, the demographic groups most similar to Tlingit-Haida are Scandinavian (1.5%, a difference of 0.050%), Estonian (1.5%, a difference of 0.23%), Croatian (1.5%, a difference of 0.25%), Hungarian (1.5%, a difference of 0.37%), and Czech (1.5%, a difference of 0.50%).
| Demographics | Rating | Rank | Disability Age Under 5 |
| Danes | 0.0 /100 | #279 | Tragic 1.5% |
| British | 0.0 /100 | #280 | Tragic 1.5% |
| Czechoslovakians | 0.0 /100 | #281 | Tragic 1.5% |
| Cheyenne | 0.0 /100 | #282 | Tragic 1.5% |
| Delaware | 0.0 /100 | #283 | Tragic 1.5% |
| Europeans | 0.0 /100 | #284 | Tragic 1.5% |
| Croatians | 0.0 /100 | #285 | Tragic 1.5% |
| Tlingit-Haida | 0.0 /100 | #286 | Tragic 1.5% |
| Scandinavians | 0.0 /100 | #287 | Tragic 1.5% |
| Estonians | 0.0 /100 | #288 | Tragic 1.5% |
| Hungarians | 0.0 /100 | #289 | Tragic 1.5% |
| Czechs | 0.0 /100 | #290 | Tragic 1.5% |
| Northern Europeans | 0.0 /100 | #291 | Tragic 1.6% |
| Italians | 0.0 /100 | #292 | Tragic 1.6% |
| Lithuanians | 0.0 /100 | #293 | Tragic 1.6% |
Tlingit-Haida Disability Age Under 5 Correlation Summary
| Measurement | Tlingit-Haida Data | Disability Age Under 5 Data |
| Minimum | 0.024% | 0.66% |
| Maximum | 76.8% | 7.9% |
| Range | 76.8% | 7.3% |
| Mean | 14.9% | 3.1% |
| Median | 9.6% | 2.4% |
| Interquartile 25% (IQ1) | 1.5% | 1.3% |
| Interquartile 75% (IQ3) | 18.6% | 5.0% |
| Interquartile Range (IQR) | 17.1% | 3.7% |
| Standard Deviation (Sample) | 20.8% | 2.2% |
| Standard Deviation (Population) | 20.1% | 2.1% |
Correlation Details
| Tlingit-Haida Percentile | Sample Size | Disability Age Under 5 |
[ 0.0% - 0.5% ] 0.024% | 46,129,768 | 0.88% |
[ 0.5% - 1.0% ] 0.55% | 591,674 | 1.3% |
[ 0.5% - 1.0% ] 0.90% | 66,398 | 0.97% |
[ 1.0% - 1.5% ] 1.21% | 8,642 | 7.9% |
[ 1.5% - 2.0% ] 1.75% | 7,363 | 5.6% |
[ 2.0% - 2.5% ] 2.30% | 7,382 | 3.9% |
[ 2.5% - 3.0% ] 2.87% | 698 | 5.6% |
[ 8.5% - 9.0% ] 9.00% | 6,691 | 1.4% |
[ 10.0% - 10.5% ] 10.13% | 2,902 | 4.5% |
[ 11.0% - 11.5% ] 11.18% | 13,913 | 0.66% |
[ 12.0% - 12.5% ] 12.26% | 18,041 | 2.9% |
[ 15.5% - 16.0% ] 15.92% | 1,727 | 1.6% |
[ 21.0% - 21.5% ] 21.23% | 4,267 | 2.2% |
[ 22.5% - 23.0% ] 22.55% | 1,073 | 1.7% |
[ 49.0% - 49.5% ] 49.33% | 1,792 | 2.7% |
[ 76.5% - 77.0% ] 76.85% | 838 | 5.6% |