Immigrants from Morocco Disability Age 5 to 17
COMPARE
Immigrants from Morocco
Select to Compare
Disability Age 5 to 17
Immigrants from Morocco Disability Age 5 to 17
5.8%
DISABILITY | AGE 5 TO 17
8.3/ 100
METRIC RATING
214th/ 347
METRIC RANK
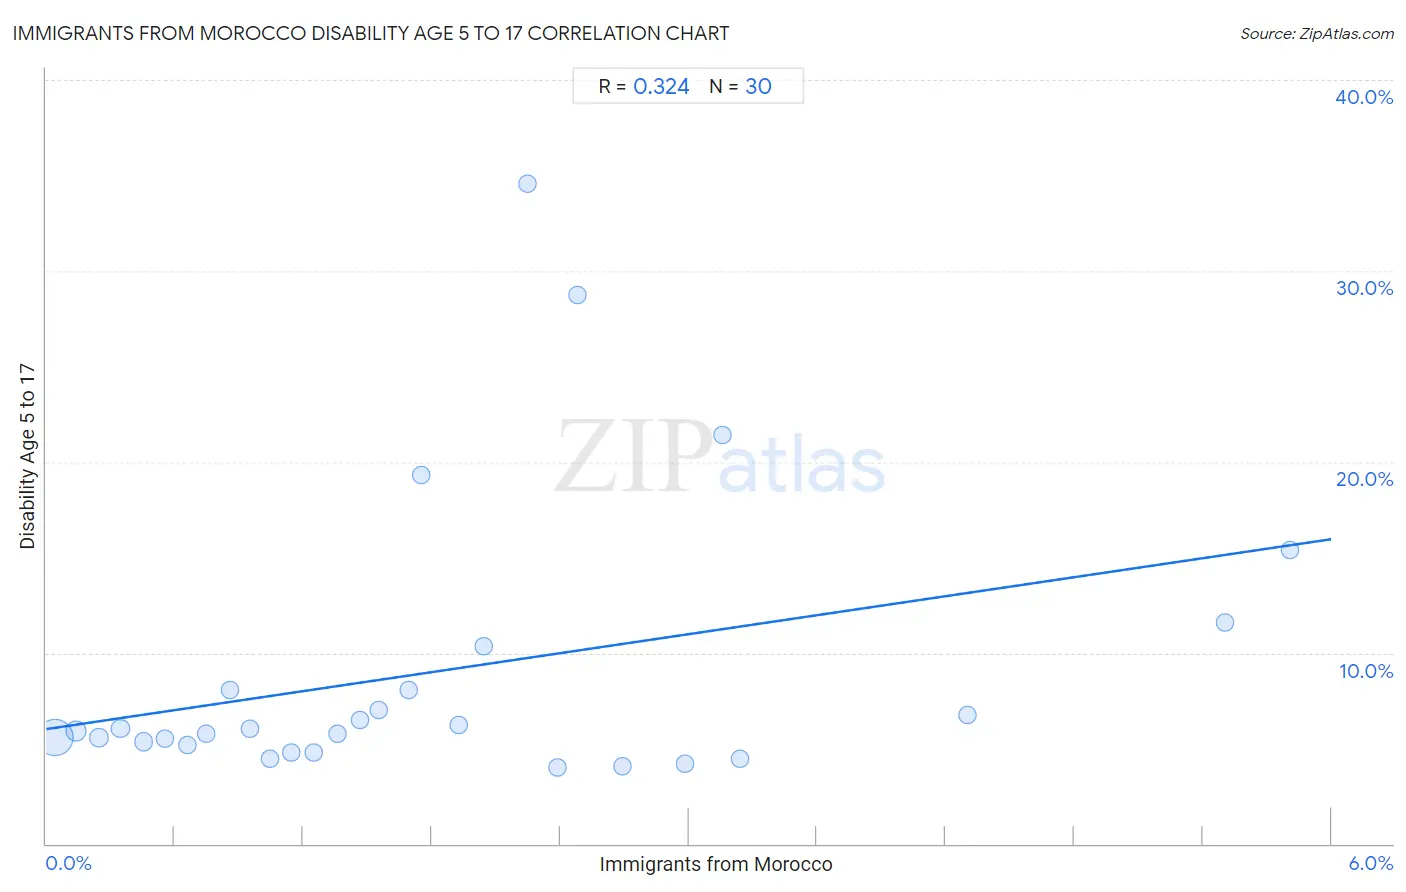
Immigrants from Morocco Disability Age 5 to 17 Correlation Chart
The statistical analysis conducted on geographies consisting of 178,475,877 people shows a mild positive correlation between the proportion of Immigrants from Morocco and percentage of population with a disability between the ages 5 and 17 in the United States with a correlation coefficient (R) of 0.324 and weighted average of 5.8%. On average, for every 1% (one percent) increase in Immigrants from Morocco within a typical geography, there is an increase of 1.7% in percentage of population with a disability between the ages 5 and 17.
It is essential to understand that the correlation between the percentage of Immigrants from Morocco and percentage of population with a disability between the ages 5 and 17 does not imply a direct cause-and-effect relationship. It remains uncertain whether the presence of Immigrants from Morocco influences an upward or downward trend in the level of percentage of population with a disability between the ages 5 and 17 within an area, or if Immigrants from Morocco simply ended up residing in those areas with higher or lower levels of percentage of population with a disability between the ages 5 and 17 due to other factors.
Demographics Similar to Immigrants from Morocco by Disability Age 5 to 17
In terms of disability age 5 to 17, the demographic groups most similar to Immigrants from Morocco are Immigrants from Cameroon (5.8%, a difference of 0.0%), Swedish (5.8%, a difference of 0.040%), Immigrants from Panama (5.8%, a difference of 0.050%), Yugoslavian (5.8%, a difference of 0.12%), and Nigerian (5.8%, a difference of 0.13%).
| Demographics | Rating | Rank | Disability Age 5 to 17 |
| Moroccans | 10.4 /100 | #207 | Poor 5.7% |
| Kenyans | 10.0 /100 | #208 | Poor 5.8% |
| Immigrants from Uganda | 9.7 /100 | #209 | Tragic 5.8% |
| Immigrants from Haiti | 9.5 /100 | #210 | Tragic 5.8% |
| Yugoslavians | 9.1 /100 | #211 | Tragic 5.8% |
| Immigrants from Panama | 8.7 /100 | #212 | Tragic 5.8% |
| Immigrants from Cameroon | 8.3 /100 | #213 | Tragic 5.8% |
| Immigrants from Morocco | 8.3 /100 | #214 | Tragic 5.8% |
| Swedes | 8.1 /100 | #215 | Tragic 5.8% |
| Nigerians | 7.5 /100 | #216 | Tragic 5.8% |
| Czechs | 7.4 /100 | #217 | Tragic 5.8% |
| Immigrants from Sierra Leone | 7.1 /100 | #218 | Tragic 5.8% |
| Sierra Leoneans | 7.0 /100 | #219 | Tragic 5.8% |
| Belgians | 6.9 /100 | #220 | Tragic 5.8% |
| Lithuanians | 6.7 /100 | #221 | Tragic 5.8% |
Immigrants from Morocco Disability Age 5 to 17 Correlation Summary
| Measurement | Immigrants from Morocco Data | Disability Age 5 to 17 Data |
| Minimum | 0.040% | 4.0% |
| Maximum | 5.8% | 34.6% |
| Range | 5.8% | 30.6% |
| Mean | 1.8% | 9.0% |
| Median | 1.5% | 6.0% |
| Interquartile 25% (IQ1) | 0.75% | 5.2% |
| Interquartile 75% (IQ3) | 2.5% | 8.0% |
| Interquartile Range (IQR) | 1.7% | 2.9% |
| Standard Deviation (Sample) | 1.5% | 7.5% |
| Standard Deviation (Population) | 1.4% | 7.4% |
Correlation Details
| Immigrants from Morocco Percentile | Sample Size | Disability Age 5 to 17 |
[ 0.0% - 0.5% ] 0.040% | 140,056,034 | 5.6% |
[ 0.0% - 0.5% ] 0.14% | 21,903,656 | 5.9% |
[ 0.0% - 0.5% ] 0.24% | 6,922,830 | 5.6% |
[ 0.0% - 0.5% ] 0.35% | 2,782,686 | 6.0% |
[ 0.0% - 0.5% ] 0.45% | 1,822,031 | 5.3% |
[ 0.5% - 1.0% ] 0.55% | 1,733,262 | 5.5% |
[ 0.5% - 1.0% ] 0.66% | 779,669 | 5.2% |
[ 0.5% - 1.0% ] 0.75% | 844,034 | 5.8% |
[ 0.5% - 1.0% ] 0.86% | 372,376 | 8.0% |
[ 0.5% - 1.0% ] 0.95% | 292,563 | 6.1% |
[ 1.0% - 1.5% ] 1.05% | 250,763 | 4.4% |
[ 1.0% - 1.5% ] 1.15% | 123,679 | 4.8% |
[ 1.0% - 1.5% ] 1.25% | 88,135 | 4.7% |
[ 1.0% - 1.5% ] 1.36% | 84,292 | 5.8% |
[ 1.0% - 1.5% ] 1.47% | 68,153 | 6.5% |
[ 1.5% - 2.0% ] 1.55% | 55,312 | 7.0% |
[ 1.5% - 2.0% ] 1.69% | 183,497 | 8.0% |
[ 1.5% - 2.0% ] 1.75% | 8,919 | 19.3% |
[ 1.5% - 2.0% ] 1.93% | 33,016 | 6.2% |
[ 2.0% - 2.5% ] 2.04% | 490 | 10.3% |
[ 2.0% - 2.5% ] 2.25% | 979 | 34.6% |
[ 2.0% - 2.5% ] 2.39% | 14,619 | 4.0% |
[ 2.0% - 2.5% ] 2.48% | 4,350 | 28.8% |
[ 2.5% - 3.0% ] 2.69% | 20,155 | 4.1% |
[ 2.5% - 3.0% ] 2.98% | 19,531 | 4.2% |
[ 3.0% - 3.5% ] 3.16% | 1,804 | 21.4% |
[ 3.0% - 3.5% ] 3.24% | 5,121 | 4.4% |
[ 4.0% - 4.5% ] 4.30% | 465 | 6.7% |
[ 5.5% - 6.0% ] 5.51% | 890 | 11.6% |
[ 5.5% - 6.0% ] 5.81% | 2,566 | 15.4% |