English Disability Age 5 to 17
COMPARE
English
Select to Compare
Disability Age 5 to 17
English Disability Age 5 to 17
6.2%
DISABILITY | AGE 5 TO 17
0.0/ 100
METRIC RATING
285th/ 347
METRIC RANK
English Disability Age 5 to 17 Correlation Chart
The statistical analysis conducted on geographies consisting of 563,308,437 people shows a substantial positive correlation between the proportion of English and percentage of population with a disability between the ages 5 and 17 in the United States with a correlation coefficient (R) of 0.541 and weighted average of 6.2%. On average, for every 1% (one percent) increase in English within a typical geography, there is an increase of 0.28% in percentage of population with a disability between the ages 5 and 17.
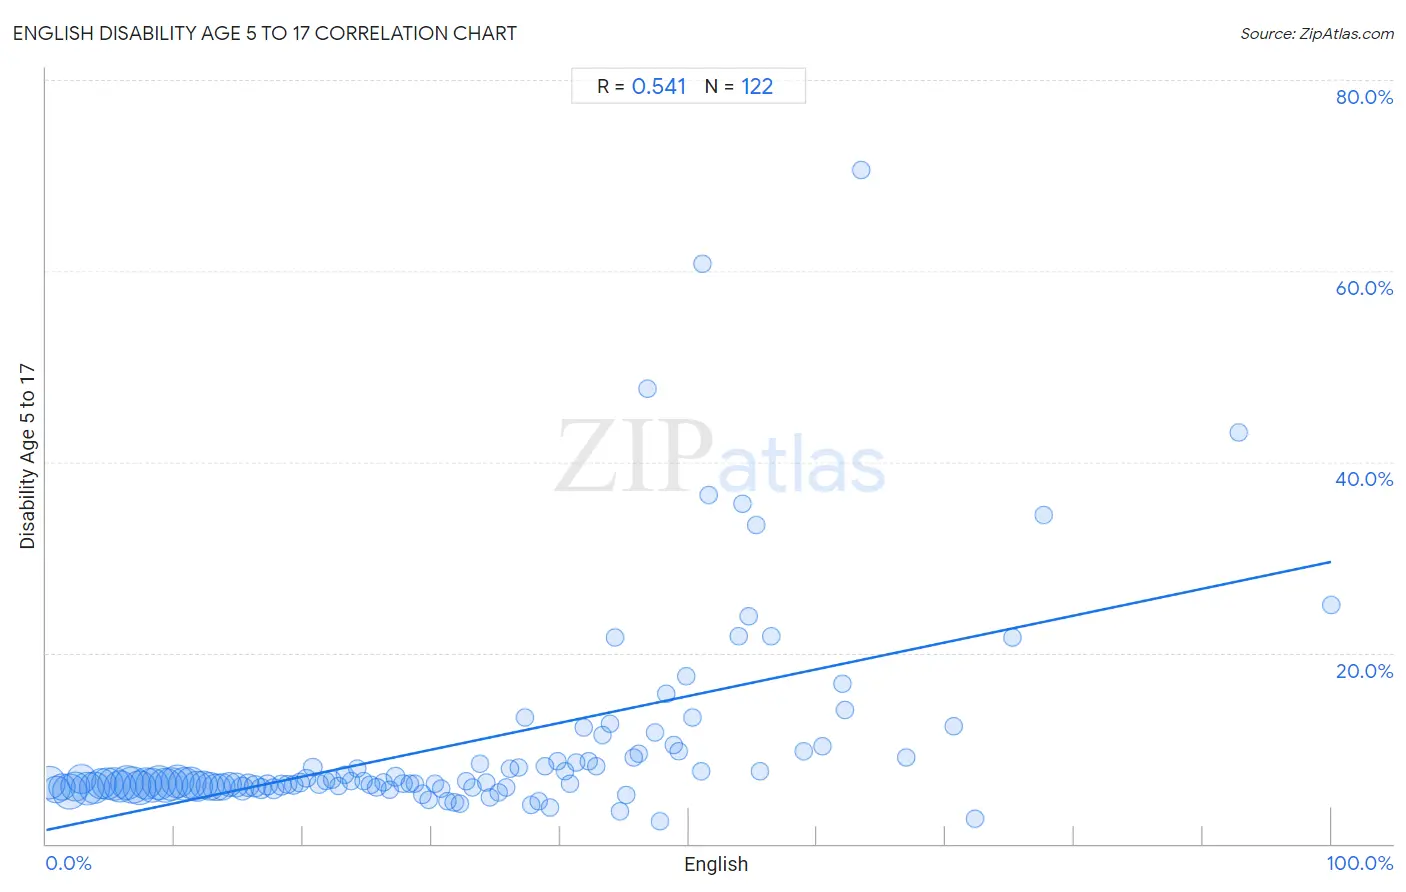
It is essential to understand that the correlation between the percentage of English and percentage of population with a disability between the ages 5 and 17 does not imply a direct cause-and-effect relationship. It remains uncertain whether the presence of English influences an upward or downward trend in the level of percentage of population with a disability between the ages 5 and 17 within an area, or if English simply ended up residing in those areas with higher or lower levels of percentage of population with a disability between the ages 5 and 17 due to other factors.
Demographics Similar to English by Disability Age 5 to 17
In terms of disability age 5 to 17, the demographic groups most similar to English are Subsaharan African (6.2%, a difference of 0.0%), Ugandan (6.2%, a difference of 0.030%), Colville (6.2%, a difference of 0.040%), German (6.1%, a difference of 0.19%), and Pima (6.2%, a difference of 0.23%).
| Demographics | Rating | Rank | Disability Age 5 to 17 |
| Immigrants from Liberia | 0.1 /100 | #278 | Tragic 6.1% |
| Immigrants from Jamaica | 0.1 /100 | #279 | Tragic 6.1% |
| Portuguese | 0.1 /100 | #280 | Tragic 6.1% |
| Scottish | 0.0 /100 | #281 | Tragic 6.1% |
| Germans | 0.0 /100 | #282 | Tragic 6.1% |
| Ugandans | 0.0 /100 | #283 | Tragic 6.2% |
| Sub-Saharan Africans | 0.0 /100 | #284 | Tragic 6.2% |
| English | 0.0 /100 | #285 | Tragic 6.2% |
| Colville | 0.0 /100 | #286 | Tragic 6.2% |
| Pima | 0.0 /100 | #287 | Tragic 6.2% |
| Jamaicans | 0.0 /100 | #288 | Tragic 6.2% |
| Yaqui | 0.0 /100 | #289 | Tragic 6.2% |
| Immigrants from Congo | 0.0 /100 | #290 | Tragic 6.2% |
| Whites/Caucasians | 0.0 /100 | #291 | Tragic 6.2% |
| Immigrants from Senegal | 0.0 /100 | #292 | Tragic 6.2% |
English Disability Age 5 to 17 Correlation Summary
| Measurement | English Data | Disability Age 5 to 17 Data |
| Minimum | 0.25% | 2.4% |
| Maximum | 100.0% | 70.5% |
| Range | 99.8% | 68.2% |
| Mean | 31.9% | 10.4% |
| Median | 30.5% | 6.4% |
| Interquartile 25% (IQ1) | 15.2% | 6.0% |
| Interquartile 75% (IQ3) | 45.8% | 9.1% |
| Interquartile Range (IQR) | 30.5% | 3.1% |
| Standard Deviation (Sample) | 20.6% | 10.7% |
| Standard Deviation (Population) | 20.5% | 10.7% |
Correlation Details
| English Percentile | Sample Size | Disability Age 5 to 17 |
[ 0.0% - 0.5% ] 0.25% | 19,507,523 | 6.4% |
[ 0.5% - 1.0% ] 0.76% | 12,807,212 | 5.7% |
[ 1.0% - 1.5% ] 1.24% | 12,785,442 | 5.9% |
[ 1.5% - 2.0% ] 1.81% | 22,355,514 | 5.4% |
[ 2.0% - 2.5% ] 2.25% | 14,098,050 | 6.0% |
[ 2.5% - 3.0% ] 2.77% | 14,271,042 | 6.8% |
[ 3.0% - 3.5% ] 3.23% | 20,224,094 | 5.8% |
[ 3.5% - 4.0% ] 3.75% | 17,588,265 | 5.8% |
[ 4.0% - 4.5% ] 4.25% | 16,610,627 | 6.3% |
[ 4.5% - 5.0% ] 4.72% | 18,548,911 | 6.3% |
[ 5.0% - 5.5% ] 5.25% | 19,242,902 | 6.2% |
[ 5.5% - 6.0% ] 5.75% | 18,007,947 | 6.1% |
[ 6.0% - 6.5% ] 6.28% | 21,284,887 | 6.5% |
[ 6.5% - 7.0% ] 6.75% | 24,775,918 | 6.2% |
[ 7.0% - 7.5% ] 7.26% | 21,034,953 | 5.9% |
[ 7.5% - 8.0% ] 7.74% | 18,925,212 | 6.3% |
[ 8.0% - 8.5% ] 8.25% | 20,831,176 | 6.1% |
[ 8.5% - 9.0% ] 8.74% | 21,051,918 | 6.4% |
[ 9.0% - 9.5% ] 9.26% | 20,639,680 | 6.1% |
[ 9.5% - 10.0% ] 9.75% | 19,087,259 | 6.2% |
[ 10.0% - 10.5% ] 10.24% | 19,604,948 | 6.5% |
[ 10.5% - 11.0% ] 10.75% | 19,706,868 | 6.3% |
[ 11.0% - 11.5% ] 11.24% | 17,408,261 | 6.4% |
[ 11.5% - 12.0% ] 11.74% | 16,606,462 | 6.0% |
[ 12.0% - 12.5% ] 12.25% | 13,448,554 | 6.2% |
[ 12.5% - 13.0% ] 12.75% | 13,024,359 | 6.0% |
[ 13.0% - 13.5% ] 13.25% | 12,207,445 | 5.9% |
[ 13.5% - 14.0% ] 13.75% | 10,038,716 | 6.0% |
[ 14.0% - 14.5% ] 14.26% | 9,754,155 | 6.2% |
[ 14.5% - 15.0% ] 14.74% | 8,284,460 | 6.1% |
[ 15.0% - 15.5% ] 15.24% | 6,945,473 | 5.8% |
[ 15.5% - 16.0% ] 15.74% | 6,076,859 | 6.1% |
[ 16.0% - 16.5% ] 16.26% | 4,811,367 | 6.0% |
[ 16.5% - 17.0% ] 16.74% | 3,699,873 | 5.8% |
[ 17.0% - 17.5% ] 17.25% | 3,485,513 | 6.1% |
[ 17.5% - 18.0% ] 17.73% | 3,273,505 | 5.8% |
[ 18.0% - 18.5% ] 18.28% | 2,841,371 | 6.1% |
[ 18.5% - 19.0% ] 18.73% | 1,599,433 | 6.2% |
[ 19.0% - 19.5% ] 19.23% | 1,881,705 | 6.2% |
[ 19.5% - 20.0% ] 19.75% | 1,472,747 | 6.4% |
[ 20.0% - 20.5% ] 20.24% | 1,316,001 | 6.9% |
[ 20.5% - 21.0% ] 20.73% | 912,787 | 8.0% |
[ 21.0% - 21.5% ] 21.23% | 1,020,321 | 6.2% |
[ 21.5% - 22.0% ] 21.75% | 679,405 | 6.6% |
[ 22.0% - 22.5% ] 22.24% | 881,690 | 6.7% |
[ 22.5% - 23.0% ] 22.76% | 687,129 | 6.0% |
[ 23.0% - 23.5% ] 23.22% | 427,739 | 7.2% |
[ 23.5% - 24.0% ] 23.74% | 469,962 | 6.5% |
[ 24.0% - 24.5% ] 24.21% | 574,710 | 7.9% |
[ 24.5% - 25.0% ] 24.69% | 466,304 | 6.6% |
[ 25.0% - 25.5% ] 25.22% | 535,982 | 6.2% |
[ 25.5% - 26.0% ] 25.72% | 457,777 | 5.9% |
[ 26.0% - 26.5% ] 26.23% | 399,207 | 6.5% |
[ 26.5% - 27.0% ] 26.74% | 624,432 | 5.6% |
[ 27.0% - 27.5% ] 27.17% | 284,930 | 7.0% |
[ 27.5% - 28.0% ] 27.76% | 338,624 | 6.3% |
[ 28.0% - 28.5% ] 28.32% | 285,874 | 6.3% |
[ 28.5% - 29.0% ] 28.71% | 171,894 | 6.3% |
[ 29.0% - 29.5% ] 29.25% | 350,960 | 5.2% |
[ 29.5% - 30.0% ] 29.75% | 221,744 | 4.6% |
[ 30.0% - 30.5% ] 30.26% | 117,754 | 6.3% |
[ 30.5% - 31.0% ] 30.73% | 252,966 | 5.8% |
[ 31.0% - 31.5% ] 31.21% | 233,243 | 4.5% |
[ 31.5% - 32.0% ] 31.75% | 318,377 | 4.3% |
[ 32.0% - 32.5% ] 32.18% | 165,458 | 4.2% |
[ 32.5% - 33.0% ] 32.71% | 107,893 | 6.5% |
[ 33.0% - 33.5% ] 33.15% | 68,780 | 5.9% |
[ 33.5% - 34.0% ] 33.79% | 30,630 | 8.4% |
[ 34.0% - 34.5% ] 34.22% | 72,647 | 6.5% |
[ 34.5% - 35.0% ] 34.56% | 248,935 | 4.8% |
[ 35.0% - 35.5% ] 35.19% | 105,053 | 5.4% |
[ 35.5% - 36.0% ] 35.83% | 145,401 | 5.9% |
[ 36.0% - 36.5% ] 36.12% | 37,827 | 7.9% |
[ 36.5% - 37.0% ] 36.72% | 9,446 | 8.0% |
[ 37.0% - 37.5% ] 37.26% | 10,520 | 13.2% |
[ 37.5% - 38.0% ] 37.74% | 111,209 | 4.1% |
[ 38.0% - 38.5% ] 38.35% | 100,509 | 4.5% |
[ 38.5% - 39.0% ] 38.80% | 14,982 | 8.1% |
[ 39.0% - 39.5% ] 39.19% | 14,814 | 3.9% |
[ 39.5% - 40.0% ] 39.76% | 11,743 | 8.6% |
[ 40.0% - 40.5% ] 40.38% | 13,778 | 7.5% |
[ 40.5% - 41.0% ] 40.71% | 24,982 | 6.3% |
[ 41.0% - 41.5% ] 41.21% | 5,339 | 8.5% |
[ 41.5% - 42.0% ] 41.79% | 5,904 | 12.2% |
[ 42.0% - 42.5% ] 42.23% | 20,413 | 8.6% |
[ 42.5% - 43.0% ] 42.85% | 7,324 | 8.1% |
[ 43.0% - 43.5% ] 43.26% | 7,809 | 11.4% |
[ 43.5% - 44.0% ] 43.84% | 1,996 | 12.5% |
[ 44.0% - 44.5% ] 44.31% | 1,713 | 21.6% |
[ 44.5% - 45.0% ] 44.63% | 11,673 | 3.4% |
[ 45.0% - 45.5% ] 45.12% | 24,837 | 5.0% |
[ 45.5% - 46.0% ] 45.77% | 5,952 | 9.1% |
[ 46.0% - 46.5% ] 46.14% | 2,202 | 9.4% |
[ 46.5% - 47.0% ] 46.80% | 406 | 47.6% |
[ 47.0% - 47.5% ] 47.33% | 5,700 | 11.7% |
[ 47.5% - 48.0% ] 47.73% | 2,309 | 2.4% |
[ 48.0% - 48.5% ] 48.26% | 2,010 | 15.7% |
[ 48.5% - 49.0% ] 48.85% | 1,441 | 10.4% |
[ 49.0% - 49.5% ] 49.25% | 2,808 | 9.7% |
[ 49.5% - 50.0% ] 49.83% | 2,681 | 17.5% |
[ 50.0% - 50.5% ] 50.33% | 3,308 | 13.3% |
[ 50.5% - 51.0% ] 50.94% | 4,258 | 7.6% |
[ 51.0% - 51.5% ] 51.07% | 327 | 60.8% |
[ 51.5% - 52.0% ] 51.57% | 1,747 | 36.5% |
[ 53.5% - 54.0% ] 53.85% | 1,012 | 21.8% |
[ 54.0% - 54.5% ] 54.16% | 1,034 | 35.7% |
[ 54.5% - 55.0% ] 54.63% | 1,349 | 23.9% |
[ 55.0% - 55.5% ] 55.26% | 38 | 33.3% |
[ 55.5% - 56.0% ] 55.51% | 708 | 7.6% |
[ 56.0% - 56.5% ] 56.42% | 966 | 21.8% |
[ 58.5% - 59.0% ] 58.91% | 404 | 9.7% |
[ 60.0% - 60.5% ] 60.40% | 894 | 10.2% |
[ 61.5% - 62.0% ] 61.93% | 1,153 | 16.8% |
[ 62.0% - 62.5% ] 62.18% | 476 | 14.1% |
[ 63.0% - 63.5% ] 63.45% | 892 | 70.5% |
[ 66.5% - 67.0% ] 66.93% | 127 | 9.1% |
[ 70.5% - 71.0% ] 70.63% | 555 | 12.3% |
[ 72.0% - 72.5% ] 72.23% | 443 | 2.7% |
[ 75.0% - 75.5% ] 75.24% | 622 | 21.6% |
[ 77.5% - 78.0% ] 77.64% | 331 | 34.5% |
[ 92.5% - 93.0% ] 92.79% | 222 | 43.1% |
[ 99.5% - 100.0% ] 100.00% | 29 | 25.0% |