Cuban Disability Age 5 to 17
COMPARE
Cuban
Select to Compare
Disability Age 5 to 17
Cuban Disability Age 5 to 17
5.3%
DISABILITY | AGE 5 TO 17
97.8/ 100
METRIC RATING
115th/ 347
METRIC RANK
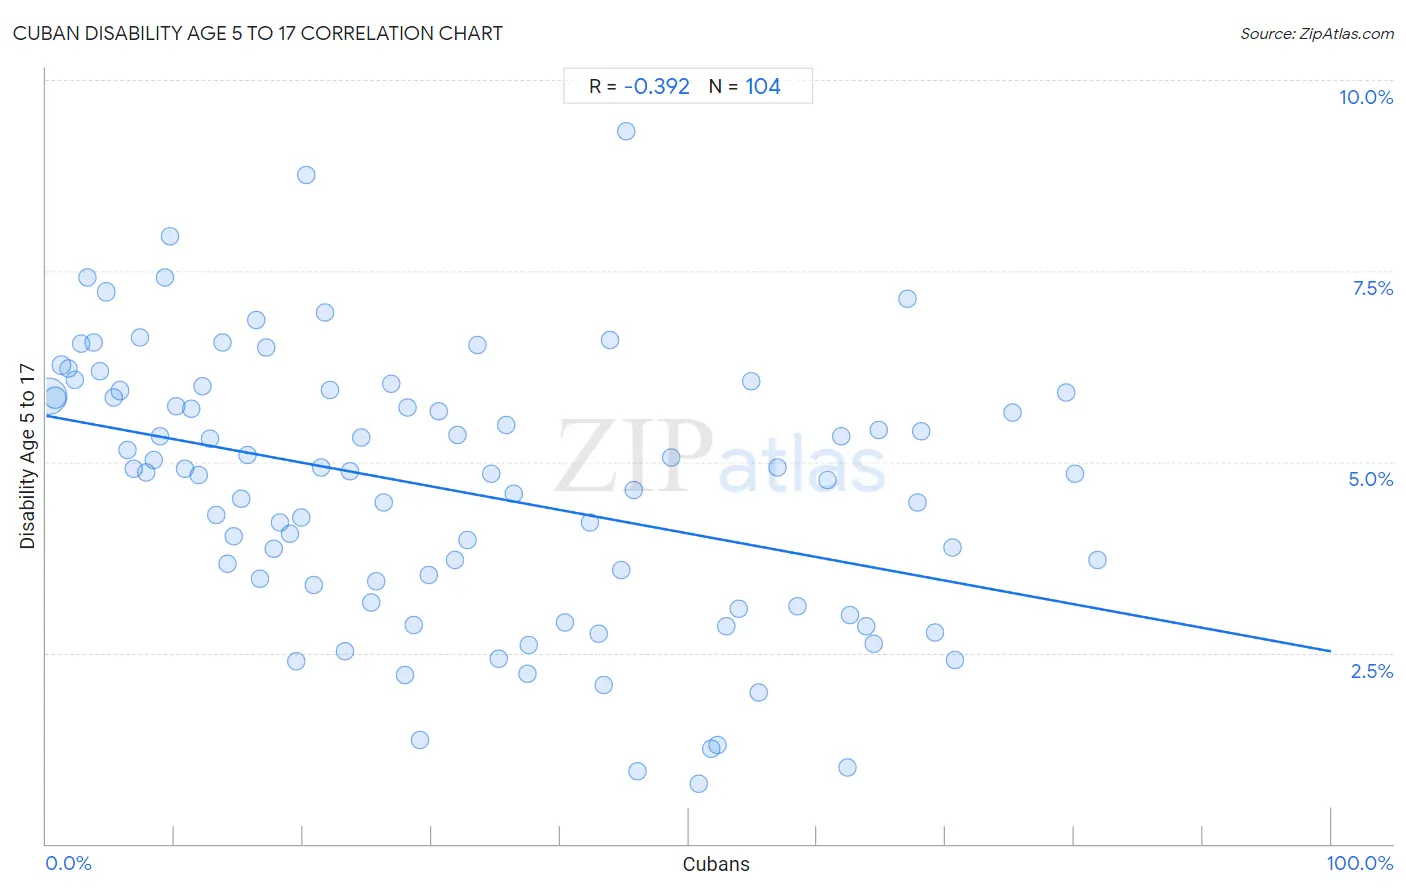
Cuban Disability Age 5 to 17 Correlation Chart
The statistical analysis conducted on geographies consisting of 444,786,844 people shows a mild negative correlation between the proportion of Cubans and percentage of population with a disability between the ages 5 and 17 in the United States with a correlation coefficient (R) of -0.392 and weighted average of 5.3%. On average, for every 1% (one percent) increase in Cubans within a typical geography, there is a decrease of 0.031% in percentage of population with a disability between the ages 5 and 17.
It is essential to understand that the correlation between the percentage of Cubans and percentage of population with a disability between the ages 5 and 17 does not imply a direct cause-and-effect relationship. It remains uncertain whether the presence of Cubans influences an upward or downward trend in the level of percentage of population with a disability between the ages 5 and 17 within an area, or if Cubans simply ended up residing in those areas with higher or lower levels of percentage of population with a disability between the ages 5 and 17 due to other factors.
Demographics Similar to Cubans by Disability Age 5 to 17
In terms of disability age 5 to 17, the demographic groups most similar to Cubans are Immigrants from Northern Europe (5.3%, a difference of 0.010%), Aleut (5.3%, a difference of 0.040%), Cypriot (5.3%, a difference of 0.060%), Immigrants from Latvia (5.3%, a difference of 0.080%), and Ethiopian (5.3%, a difference of 0.10%).
| Demographics | Rating | Rank | Disability Age 5 to 17 |
| Immigrants from South Africa | 98.1 /100 | #108 | Exceptional 5.3% |
| Immigrants from Northern Africa | 98.1 /100 | #109 | Exceptional 5.3% |
| Immigrants from Eritrea | 98.0 /100 | #110 | Exceptional 5.3% |
| Ethiopians | 97.9 /100 | #111 | Exceptional 5.3% |
| Immigrants from Latvia | 97.9 /100 | #112 | Exceptional 5.3% |
| Aleuts | 97.8 /100 | #113 | Exceptional 5.3% |
| Immigrants from Northern Europe | 97.8 /100 | #114 | Exceptional 5.3% |
| Cubans | 97.8 /100 | #115 | Exceptional 5.3% |
| Cypriots | 97.7 /100 | #116 | Exceptional 5.3% |
| Immigrants from Afghanistan | 97.4 /100 | #117 | Exceptional 5.3% |
| South Americans | 97.1 /100 | #118 | Exceptional 5.4% |
| Immigrants from South America | 97.1 /100 | #119 | Exceptional 5.4% |
| Immigrants | 97.0 /100 | #120 | Exceptional 5.4% |
| Maltese | 96.0 /100 | #121 | Exceptional 5.4% |
| Chileans | 95.8 /100 | #122 | Exceptional 5.4% |
Cuban Disability Age 5 to 17 Correlation Summary
| Measurement | Cuban Data | Disability Age 5 to 17 Data |
| Minimum | 0.21% | 0.78% |
| Maximum | 81.9% | 9.3% |
| Range | 81.6% | 8.5% |
| Mean | 31.8% | 4.6% |
| Median | 27.4% | 4.9% |
| Interquartile 25% (IQ1) | 13.0% | 3.3% |
| Interquartile 75% (IQ3) | 49.7% | 5.9% |
| Interquartile Range (IQR) | 36.7% | 2.6% |
| Standard Deviation (Sample) | 22.4% | 1.8% |
| Standard Deviation (Population) | 22.3% | 1.8% |
Correlation Details
| Cuban Percentile | Sample Size | Disability Age 5 to 17 |
[ 0.0% - 0.5% ] 0.21% | 331,296,793 | 5.9% |
[ 0.5% - 1.0% ] 0.69% | 59,649,335 | 5.8% |
[ 1.0% - 1.5% ] 1.21% | 16,485,848 | 6.3% |
[ 1.5% - 2.0% ] 1.70% | 9,639,544 | 6.2% |
[ 2.0% - 2.5% ] 2.24% | 5,552,974 | 6.1% |
[ 2.5% - 3.0% ] 2.73% | 4,728,193 | 6.5% |
[ 3.0% - 3.5% ] 3.24% | 2,285,427 | 7.4% |
[ 3.5% - 4.0% ] 3.73% | 1,847,404 | 6.6% |
[ 4.0% - 4.5% ] 4.22% | 1,120,277 | 6.2% |
[ 4.5% - 5.0% ] 4.71% | 811,127 | 7.2% |
[ 5.0% - 5.5% ] 5.27% | 804,105 | 5.8% |
[ 5.5% - 6.0% ] 5.70% | 720,149 | 5.9% |
[ 6.0% - 6.5% ] 6.28% | 521,502 | 5.2% |
[ 6.5% - 7.0% ] 6.79% | 344,078 | 4.9% |
[ 7.0% - 7.5% ] 7.31% | 452,655 | 6.6% |
[ 7.5% - 8.0% ] 7.75% | 843,361 | 4.9% |
[ 8.0% - 8.5% ] 8.34% | 341,523 | 5.0% |
[ 8.5% - 9.0% ] 8.86% | 332,988 | 5.3% |
[ 9.0% - 9.5% ] 9.27% | 249,264 | 7.4% |
[ 9.5% - 10.0% ] 9.66% | 103,888 | 7.9% |
[ 10.0% - 10.5% ] 10.11% | 280,599 | 5.7% |
[ 10.5% - 11.0% ] 10.76% | 165,496 | 4.9% |
[ 11.0% - 11.5% ] 11.25% | 191,813 | 5.7% |
[ 11.5% - 12.0% ] 11.82% | 83,709 | 4.8% |
[ 12.0% - 12.5% ] 12.16% | 189,386 | 6.0% |
[ 12.5% - 13.0% ] 12.79% | 138,381 | 5.3% |
[ 13.0% - 13.5% ] 13.25% | 253,159 | 4.3% |
[ 13.5% - 14.0% ] 13.75% | 142,462 | 6.6% |
[ 14.0% - 14.5% ] 14.07% | 32,110 | 3.7% |
[ 14.5% - 15.0% ] 14.62% | 100,510 | 4.0% |
[ 15.0% - 15.5% ] 15.14% | 354,114 | 4.5% |
[ 15.5% - 16.0% ] 15.67% | 7,385 | 5.1% |
[ 16.0% - 16.5% ] 16.37% | 55,764 | 6.9% |
[ 16.5% - 17.0% ] 16.65% | 17,817 | 3.5% |
[ 17.0% - 17.5% ] 17.12% | 142,560 | 6.5% |
[ 17.5% - 18.0% ] 17.73% | 84,824 | 3.9% |
[ 18.0% - 18.5% ] 18.15% | 180,995 | 4.2% |
[ 18.5% - 19.0% ] 18.94% | 74,371 | 4.1% |
[ 19.0% - 19.5% ] 19.48% | 13,265 | 2.4% |
[ 19.5% - 20.0% ] 19.81% | 96,654 | 4.3% |
[ 20.0% - 20.5% ] 20.27% | 79,996 | 8.8% |
[ 20.5% - 21.0% ] 20.86% | 124,371 | 3.4% |
[ 21.0% - 21.5% ] 21.40% | 53,076 | 4.9% |
[ 21.5% - 22.0% ] 21.70% | 40,853 | 7.0% |
[ 22.0% - 22.5% ] 22.05% | 77,008 | 5.9% |
[ 23.0% - 23.5% ] 23.26% | 516 | 2.5% |
[ 23.5% - 24.0% ] 23.67% | 47,383 | 4.9% |
[ 24.5% - 25.0% ] 24.54% | 10,520 | 5.3% |
[ 25.0% - 25.5% ] 25.25% | 123,956 | 3.2% |
[ 25.5% - 26.0% ] 25.70% | 124,904 | 3.4% |
[ 26.0% - 26.5% ] 26.23% | 33,851 | 4.5% |
[ 26.5% - 27.0% ] 26.84% | 55,487 | 6.0% |
[ 27.5% - 28.0% ] 27.92% | 15,184 | 2.2% |
[ 28.0% - 28.5% ] 28.15% | 96,294 | 5.7% |
[ 28.5% - 29.0% ] 28.65% | 81,384 | 2.9% |
[ 29.0% - 29.5% ] 29.11% | 35,969 | 1.4% |
[ 29.5% - 30.0% ] 29.72% | 44,956 | 3.5% |
[ 30.5% - 31.0% ] 30.57% | 69,152 | 5.7% |
[ 31.5% - 32.0% ] 31.84% | 112,692 | 3.7% |
[ 32.0% - 32.5% ] 32.04% | 497,852 | 5.4% |
[ 32.5% - 33.0% ] 32.78% | 149,749 | 4.0% |
[ 33.5% - 34.0% ] 33.61% | 80,738 | 6.5% |
[ 34.5% - 35.0% ] 34.64% | 78,402 | 4.8% |
[ 35.0% - 35.5% ] 35.19% | 142,880 | 2.4% |
[ 35.5% - 36.0% ] 35.76% | 17,902 | 5.5% |
[ 36.0% - 36.5% ] 36.37% | 23,094 | 4.6% |
[ 37.0% - 37.5% ] 37.45% | 2,318 | 2.2% |
[ 37.5% - 38.0% ] 37.56% | 26,994 | 2.6% |
[ 40.0% - 40.5% ] 40.39% | 40,278 | 2.9% |
[ 42.0% - 42.5% ] 42.36% | 88,933 | 4.2% |
[ 42.5% - 43.0% ] 42.99% | 29,240 | 2.8% |
[ 43.0% - 43.5% ] 43.35% | 76,412 | 2.1% |
[ 43.5% - 44.0% ] 43.83% | 105,481 | 6.6% |
[ 44.5% - 45.0% ] 44.76% | 45,669 | 3.6% |
[ 45.0% - 45.5% ] 45.18% | 35,705 | 9.3% |
[ 45.5% - 46.0% ] 45.68% | 68,602 | 4.6% |
[ 46.0% - 46.5% ] 46.05% | 33,026 | 0.95% |
[ 48.5% - 49.0% ] 48.64% | 81,858 | 5.1% |
[ 50.5% - 51.0% ] 50.74% | 3,400 | 0.78% |
[ 51.5% - 52.0% ] 51.73% | 34,335 | 1.2% |
[ 52.0% - 52.5% ] 52.27% | 13,163 | 1.3% |
[ 52.5% - 53.0% ] 52.97% | 29,530 | 2.9% |
[ 53.5% - 54.0% ] 53.92% | 35,606 | 3.1% |
[ 54.5% - 55.0% ] 54.83% | 34,057 | 6.1% |
[ 55.0% - 55.5% ] 55.44% | 19,399 | 2.0% |
[ 56.5% - 57.0% ] 56.95% | 52,661 | 4.9% |
[ 58.0% - 58.5% ] 58.48% | 43,702 | 3.1% |
[ 60.5% - 61.0% ] 60.80% | 52,101 | 4.8% |
[ 61.5% - 62.0% ] 61.83% | 30,621 | 5.3% |
[ 62.0% - 62.5% ] 62.37% | 13,877 | 1.0% |
[ 62.5% - 63.0% ] 62.57% | 55,241 | 3.0% |
[ 63.5% - 64.0% ] 63.81% | 52,851 | 2.9% |
[ 64.0% - 64.5% ] 64.40% | 53,765 | 2.6% |
[ 64.5% - 65.0% ] 64.80% | 24,597 | 5.4% |
[ 67.0% - 67.5% ] 67.07% | 45,620 | 7.1% |
[ 67.5% - 68.0% ] 67.76% | 104,796 | 4.5% |
[ 68.0% - 68.5% ] 68.14% | 10,725 | 5.4% |
[ 69.0% - 69.5% ] 69.21% | 20,850 | 2.8% |
[ 70.0% - 70.5% ] 70.49% | 52,047 | 3.9% |
[ 70.5% - 71.0% ] 70.69% | 22,815 | 2.4% |
[ 75.0% - 75.5% ] 75.16% | 249,592 | 5.6% |
[ 79.0% - 79.5% ] 79.36% | 42,081 | 5.9% |
[ 80.0% - 80.5% ] 80.06% | 71,088 | 4.8% |
[ 81.5% - 82.0% ] 81.85% | 29,830 | 3.7% |