Tlingit-Haida Female Disability
COMPARE
Tlingit-Haida
Select to Compare
Female Disability
Tlingit-Haida Female Disability
13.2%
DISABILITY | FEMALES
0.0/ 100
METRIC RATING
289th/ 347
METRIC RANK
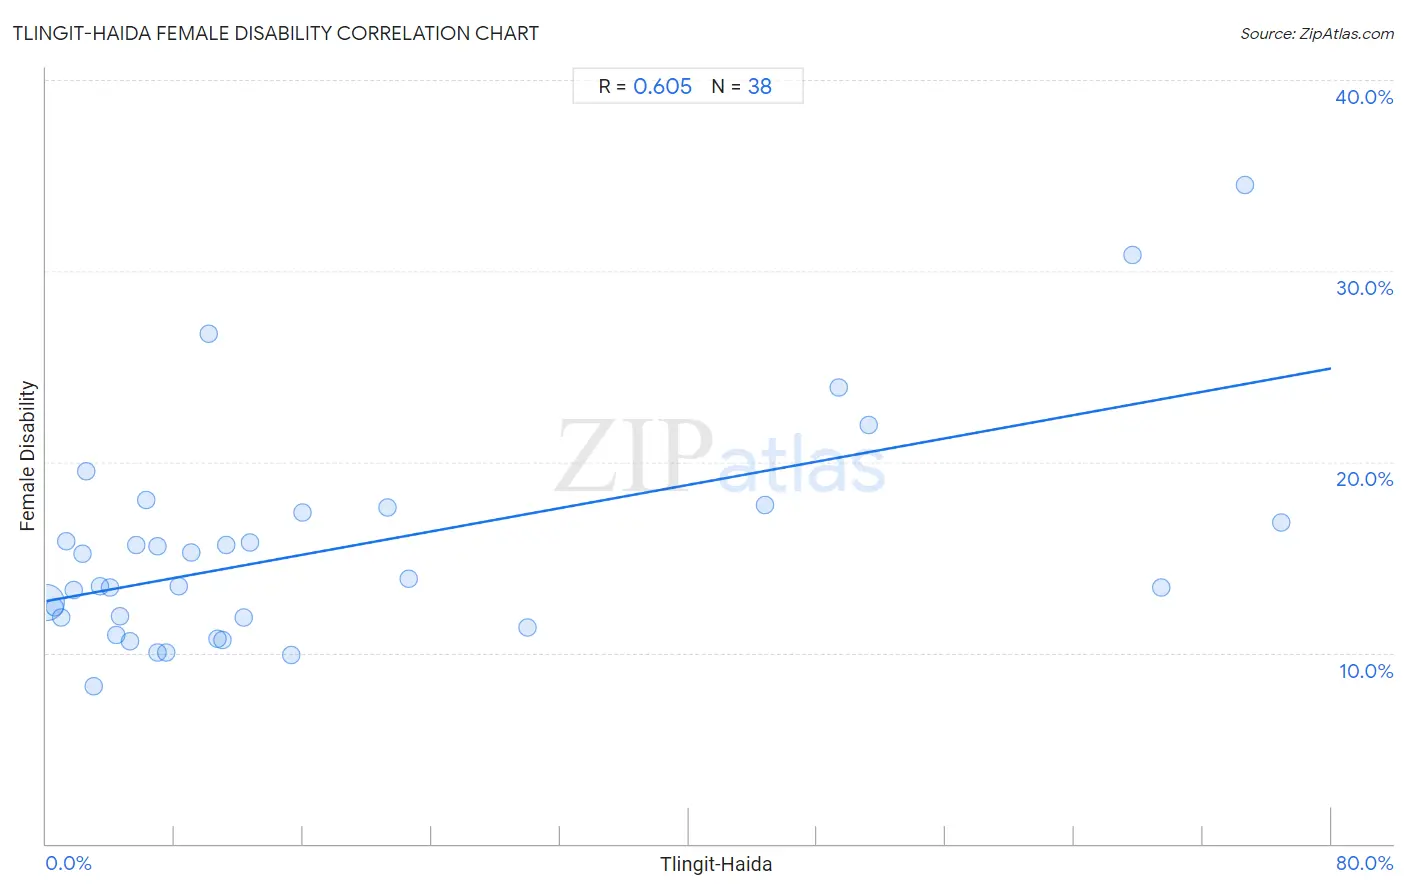
Tlingit-Haida Female Disability Correlation Chart
The statistical analysis conducted on geographies consisting of 60,854,290 people shows a significant positive correlation between the proportion of Tlingit-Haida and percentage of females with a disability in the United States with a correlation coefficient (R) of 0.605 and weighted average of 13.2%. On average, for every 1% (one percent) increase in Tlingit-Haida within a typical geography, there is an increase of 0.15% in percentage of females with a disability.
It is essential to understand that the correlation between the percentage of Tlingit-Haida and percentage of females with a disability does not imply a direct cause-and-effect relationship. It remains uncertain whether the presence of Tlingit-Haida influences an upward or downward trend in the level of percentage of females with a disability within an area, or if Tlingit-Haida simply ended up residing in those areas with higher or lower levels of percentage of females with a disability due to other factors.
Demographics Similar to Tlingit-Haida by Female Disability
In terms of female disability, the demographic groups most similar to Tlingit-Haida are Immigrants from Yemen (13.2%, a difference of 0.0%), Shoshone (13.2%, a difference of 0.060%), White/Caucasian (13.2%, a difference of 0.17%), Yakama (13.2%, a difference of 0.23%), and Yaqui (13.2%, a difference of 0.27%).
| Demographics | Rating | Rank | Female Disability |
| Welsh | 0.0 /100 | #282 | Tragic 13.1% |
| English | 0.0 /100 | #283 | Tragic 13.1% |
| Hmong | 0.0 /100 | #284 | Tragic 13.1% |
| Bangladeshis | 0.0 /100 | #285 | Tragic 13.1% |
| Fijians | 0.0 /100 | #286 | Tragic 13.1% |
| Yaqui | 0.0 /100 | #287 | Tragic 13.2% |
| Whites/Caucasians | 0.0 /100 | #288 | Tragic 13.2% |
| Tlingit-Haida | 0.0 /100 | #289 | Tragic 13.2% |
| Immigrants from Yemen | 0.0 /100 | #290 | Tragic 13.2% |
| Shoshone | 0.0 /100 | #291 | Tragic 13.2% |
| Yakama | 0.0 /100 | #292 | Tragic 13.2% |
| Marshallese | 0.0 /100 | #293 | Tragic 13.3% |
| Celtics | 0.0 /100 | #294 | Tragic 13.3% |
| French | 0.0 /100 | #295 | Tragic 13.3% |
| Nepalese | 0.0 /100 | #296 | Tragic 13.3% |
Tlingit-Haida Female Disability Correlation Summary
| Measurement | Tlingit-Haida Data | Female Disability Data |
| Minimum | 0.036% | 8.2% |
| Maximum | 76.8% | 34.5% |
| Range | 76.8% | 26.2% |
| Mean | 18.2% | 15.5% |
| Median | 8.6% | 13.7% |
| Interquartile 25% (IQ1) | 4.0% | 11.8% |
| Interquartile 75% (IQ3) | 21.2% | 17.3% |
| Interquartile Range (IQR) | 17.3% | 5.5% |
| Standard Deviation (Sample) | 22.6% | 5.7% |
| Standard Deviation (Population) | 22.3% | 5.6% |
Correlation Details
| Tlingit-Haida Percentile | Sample Size | Female Disability |
[ 0.0% - 0.5% ] 0.036% | 59,016,735 | 12.6% |
[ 0.5% - 1.0% ] 0.54% | 1,312,339 | 12.4% |
[ 0.5% - 1.0% ] 0.91% | 247,818 | 11.9% |
[ 1.0% - 1.5% ] 1.24% | 85,687 | 15.9% |
[ 1.5% - 2.0% ] 1.71% | 25,685 | 13.3% |
[ 2.0% - 2.5% ] 2.28% | 8,447 | 15.2% |
[ 2.0% - 2.5% ] 2.46% | 3,821 | 19.5% |
[ 2.5% - 3.0% ] 2.92% | 6,231 | 8.2% |
[ 3.0% - 3.5% ] 3.33% | 10,388 | 13.5% |
[ 3.5% - 4.0% ] 3.97% | 1,964 | 13.4% |
[ 4.0% - 4.5% ] 4.35% | 115 | 10.9% |
[ 4.5% - 5.0% ] 4.62% | 822 | 11.9% |
[ 5.0% - 5.5% ] 5.24% | 420 | 10.6% |
[ 5.5% - 6.0% ] 5.62% | 1,762 | 15.6% |
[ 6.0% - 6.5% ] 6.21% | 177 | 18.0% |
[ 6.5% - 7.0% ] 6.91% | 564 | 10.0% |
[ 6.5% - 7.0% ] 6.94% | 2,146 | 15.6% |
[ 7.0% - 7.5% ] 7.50% | 40 | 10.0% |
[ 8.0% - 8.5% ] 8.22% | 146 | 13.5% |
[ 8.5% - 9.0% ] 9.00% | 6,691 | 15.2% |
[ 10.0% - 10.5% ] 10.13% | 2,902 | 26.7% |
[ 10.5% - 11.0% ] 10.70% | 29,933 | 10.8% |
[ 11.0% - 11.5% ] 11.00% | 32,108 | 10.7% |
[ 11.0% - 11.5% ] 11.18% | 13,913 | 15.7% |
[ 12.0% - 12.5% ] 12.26% | 18,041 | 11.8% |
[ 12.5% - 13.0% ] 12.66% | 8,647 | 15.8% |
[ 15.0% - 15.5% ] 15.26% | 2,169 | 9.9% |
[ 15.5% - 16.0% ] 15.92% | 1,727 | 17.3% |
[ 21.0% - 21.5% ] 21.23% | 4,267 | 17.6% |
[ 22.5% - 23.0% ] 22.55% | 1,073 | 13.9% |
[ 29.5% - 30.0% ] 29.96% | 1,128 | 11.3% |
[ 44.5% - 45.0% ] 44.78% | 920 | 17.7% |
[ 49.0% - 49.5% ] 49.33% | 1,792 | 23.9% |
[ 51.0% - 51.5% ] 51.24% | 804 | 21.9% |
[ 67.5% - 68.0% ] 67.59% | 361 | 30.9% |
[ 69.0% - 69.5% ] 69.41% | 1,602 | 13.4% |
[ 74.5% - 75.0% ] 74.63% | 67 | 34.5% |
[ 76.5% - 77.0% ] 76.85% | 838 | 16.8% |