Basque Disability Age 5 to 17
COMPARE
Basque
Select to Compare
Disability Age 5 to 17
Basque Disability Age 5 to 17
5.7%
DISABILITY | AGE 5 TO 17
13.7/ 100
METRIC RATING
201st/ 347
METRIC RANK
Basque Disability Age 5 to 17 Correlation Chart
The statistical analysis conducted on geographies consisting of 165,145,807 people shows a moderate positive correlation between the proportion of Basques and percentage of population with a disability between the ages 5 and 17 in the United States with a correlation coefficient (R) of 0.497 and weighted average of 5.7%. On average, for every 1% (one percent) increase in Basques within a typical geography, there is an increase of 0.81% in percentage of population with a disability between the ages 5 and 17.
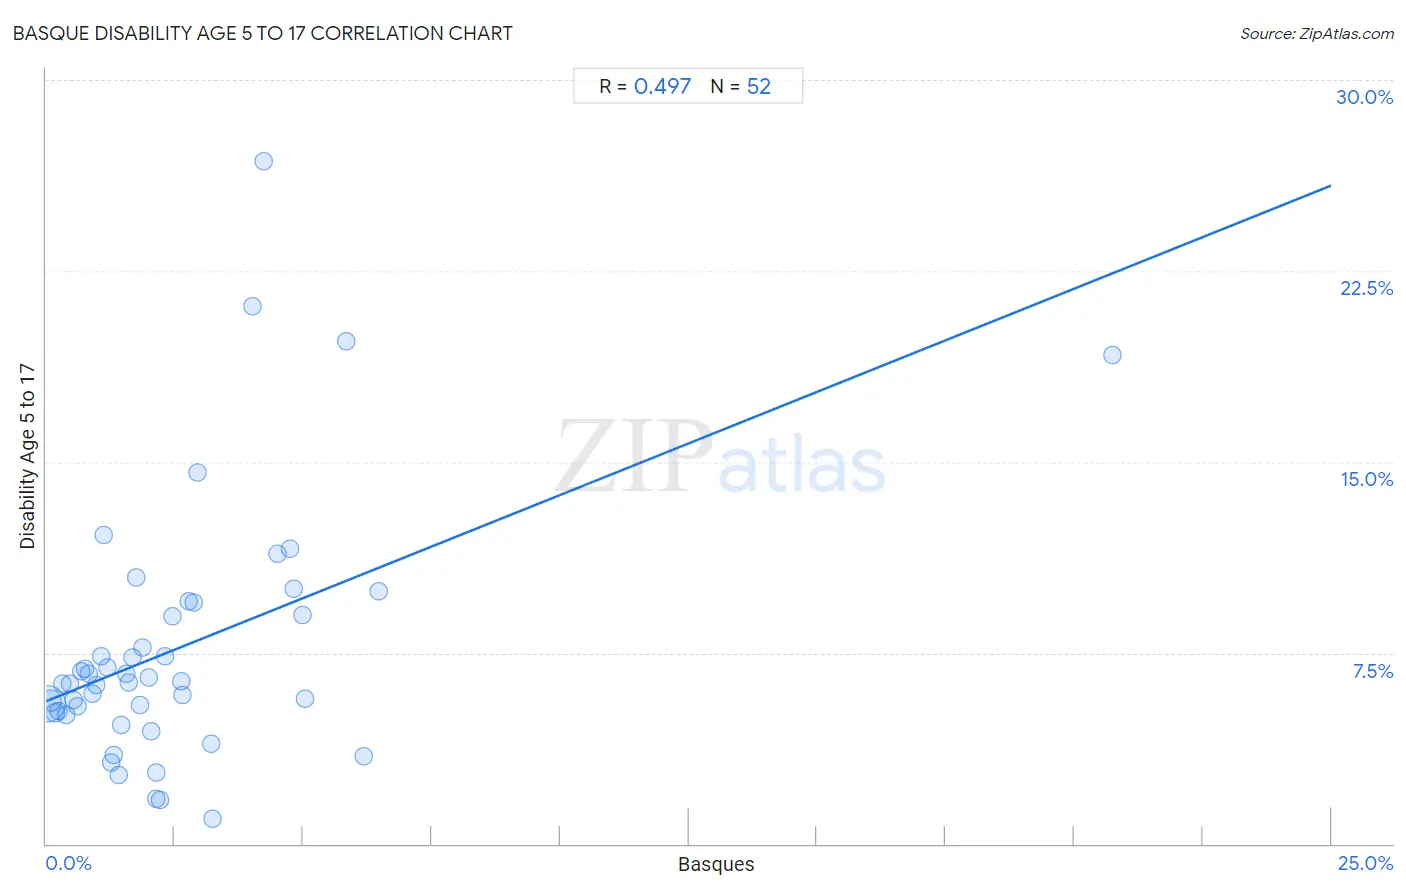
It is essential to understand that the correlation between the percentage of Basques and percentage of population with a disability between the ages 5 and 17 does not imply a direct cause-and-effect relationship. It remains uncertain whether the presence of Basques influences an upward or downward trend in the level of percentage of population with a disability between the ages 5 and 17 within an area, or if Basques simply ended up residing in those areas with higher or lower levels of percentage of population with a disability between the ages 5 and 17 due to other factors.
Demographics Similar to Basques by Disability Age 5 to 17
In terms of disability age 5 to 17, the demographic groups most similar to Basques are Austrian (5.7%, a difference of 0.050%), Icelander (5.7%, a difference of 0.090%), Spanish American Indian (5.7%, a difference of 0.090%), Northern European (5.7%, a difference of 0.15%), and Paiute (5.7%, a difference of 0.27%).
| Demographics | Rating | Rank | Disability Age 5 to 17 |
| Croatians | 23.6 /100 | #194 | Fair 5.7% |
| Immigrants from Nigeria | 23.4 /100 | #195 | Fair 5.7% |
| Inupiat | 23.3 /100 | #196 | Fair 5.7% |
| Immigrants from North America | 23.1 /100 | #197 | Fair 5.7% |
| Norwegians | 20.9 /100 | #198 | Fair 5.7% |
| Northern Europeans | 15.2 /100 | #199 | Poor 5.7% |
| Icelanders | 14.6 /100 | #200 | Poor 5.7% |
| Basques | 13.7 /100 | #201 | Poor 5.7% |
| Austrians | 13.2 /100 | #202 | Poor 5.7% |
| Spanish American Indians | 12.8 /100 | #203 | Poor 5.7% |
| Paiute | 11.2 /100 | #204 | Poor 5.7% |
| Trinidadians and Tobagonians | 10.8 /100 | #205 | Poor 5.7% |
| Immigrants from Africa | 10.8 /100 | #206 | Poor 5.7% |
| Moroccans | 10.4 /100 | #207 | Poor 5.7% |
| Kenyans | 10.0 /100 | #208 | Poor 5.8% |
Basque Disability Age 5 to 17 Correlation Summary
| Measurement | Basque Data | Disability Age 5 to 17 Data |
| Minimum | 0.025% | 0.97% |
| Maximum | 20.7% | 26.8% |
| Range | 20.7% | 25.9% |
| Mean | 2.6% | 7.7% |
| Median | 1.9% | 6.4% |
| Interquartile 25% (IQ1) | 0.94% | 5.2% |
| Interquartile 75% (IQ3) | 3.1% | 9.2% |
| Interquartile Range (IQR) | 2.1% | 4.0% |
| Standard Deviation (Sample) | 3.1% | 5.0% |
| Standard Deviation (Population) | 3.0% | 4.9% |
Correlation Details
| Basque Percentile | Sample Size | Disability Age 5 to 17 |
[ 0.0% - 0.5% ] 0.025% | 131,566,239 | 5.5% |
[ 0.0% - 0.5% ] 0.098% | 18,825,420 | 5.6% |
[ 0.0% - 0.5% ] 0.18% | 5,976,527 | 5.1% |
[ 0.0% - 0.5% ] 0.24% | 3,254,471 | 5.2% |
[ 0.0% - 0.5% ] 0.32% | 1,890,410 | 6.3% |
[ 0.0% - 0.5% ] 0.39% | 814,289 | 5.1% |
[ 0.0% - 0.5% ] 0.46% | 373,665 | 6.3% |
[ 0.5% - 1.0% ] 0.54% | 600,498 | 5.7% |
[ 0.5% - 1.0% ] 0.60% | 289,420 | 5.4% |
[ 0.5% - 1.0% ] 0.69% | 128,400 | 6.8% |
[ 0.5% - 1.0% ] 0.77% | 135,659 | 6.9% |
[ 0.5% - 1.0% ] 0.82% | 71,141 | 6.7% |
[ 0.5% - 1.0% ] 0.90% | 107,101 | 5.9% |
[ 0.5% - 1.0% ] 0.97% | 164,471 | 6.2% |
[ 1.0% - 1.5% ] 1.06% | 49,877 | 7.3% |
[ 1.0% - 1.5% ] 1.11% | 13,134 | 12.1% |
[ 1.0% - 1.5% ] 1.19% | 375,274 | 6.9% |
[ 1.0% - 1.5% ] 1.25% | 83,927 | 3.2% |
[ 1.0% - 1.5% ] 1.32% | 46,316 | 3.5% |
[ 1.0% - 1.5% ] 1.41% | 24,791 | 2.7% |
[ 1.0% - 1.5% ] 1.46% | 31,410 | 4.7% |
[ 1.5% - 2.0% ] 1.55% | 9,574 | 6.7% |
[ 1.5% - 2.0% ] 1.60% | 35,644 | 6.3% |
[ 1.5% - 2.0% ] 1.67% | 51,828 | 7.3% |
[ 1.5% - 2.0% ] 1.74% | 14,170 | 10.5% |
[ 1.5% - 2.0% ] 1.83% | 42,698 | 5.5% |
[ 1.5% - 2.0% ] 1.88% | 15,954 | 7.7% |
[ 1.5% - 2.0% ] 1.99% | 9,217 | 6.5% |
[ 2.0% - 2.5% ] 2.05% | 26,023 | 4.4% |
[ 2.0% - 2.5% ] 2.13% | 1,687 | 1.8% |
[ 2.0% - 2.5% ] 2.15% | 2,937 | 2.8% |
[ 2.0% - 2.5% ] 2.22% | 676 | 1.7% |
[ 2.0% - 2.5% ] 2.30% | 44,711 | 7.4% |
[ 2.0% - 2.5% ] 2.45% | 10,704 | 8.9% |
[ 2.5% - 3.0% ] 2.63% | 4,594 | 6.4% |
[ 2.5% - 3.0% ] 2.66% | 6,324 | 5.8% |
[ 2.5% - 3.0% ] 2.78% | 3,673 | 9.5% |
[ 2.5% - 3.0% ] 2.86% | 594 | 9.5% |
[ 2.5% - 3.0% ] 2.94% | 4,664 | 14.6% |
[ 3.0% - 3.5% ] 3.21% | 498 | 3.9% |
[ 3.0% - 3.5% ] 3.24% | 9,217 | 0.97% |
[ 4.0% - 4.5% ] 4.02% | 1,665 | 21.1% |
[ 4.0% - 4.5% ] 4.23% | 260 | 26.8% |
[ 4.5% - 5.0% ] 4.50% | 1,643 | 11.4% |
[ 4.5% - 5.0% ] 4.75% | 1,874 | 11.6% |
[ 4.5% - 5.0% ] 4.81% | 1,122 | 10.0% |
[ 4.5% - 5.0% ] 4.99% | 8,170 | 9.0% |
[ 5.0% - 5.5% ] 5.03% | 2,643 | 5.7% |
[ 5.5% - 6.0% ] 5.85% | 496 | 19.7% |
[ 6.0% - 6.5% ] 6.18% | 3,041 | 3.4% |
[ 6.0% - 6.5% ] 6.47% | 6,169 | 9.9% |
[ 20.5% - 21.0% ] 20.74% | 897 | 19.2% |